Figure 7.
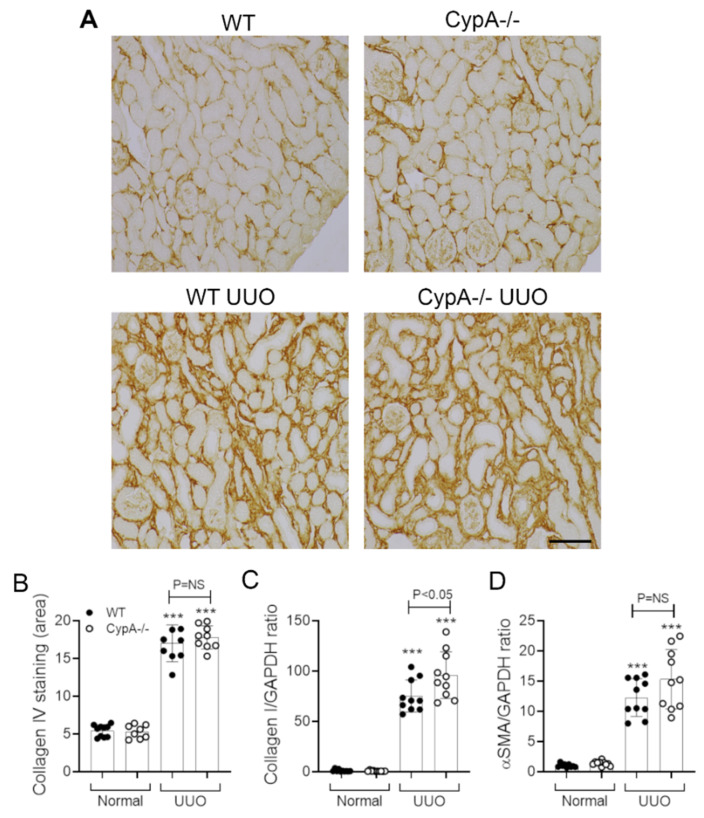
Renal fibrosis in day 7 UUO kidney compared to normal controls for WT (closed circles) and CypA−/− (open circles) mice. (A) Immunoperoxidase staining for collagen IV in the different groups. Bar = 100 μm. (B) Quantification of the area of interstitial collagen IV staining. RT-PCR for mRNA levels of: (C) collagen I and (D) α-SMA/ACTA2. Data are mean ± SD. *** p < 0.0001 versus WT sham control; NS, not significant.

