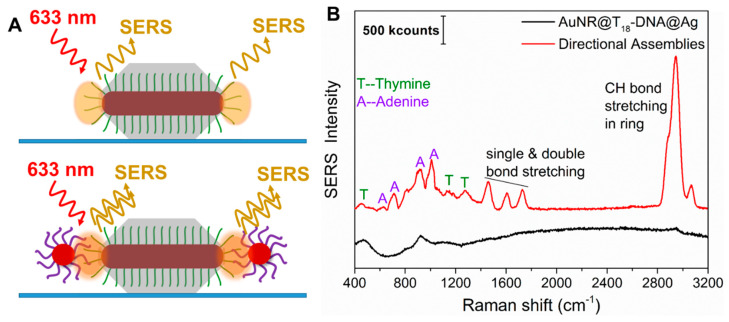
Figure 5.
(A) Sketch of the anisotropic directional building blocks (AuNRs@T18-DNA@Ag50min, top) and their anisotropic directional nanoassemblies (bottom). The orange shading highlights the spots of highest electric-field enhancement, i.e., the strategically positioned hot-spots that can lead to SERS of the ssDNA (top panel) or of the dsDNA (bottom panel). (B) Representative SERS spectra of a single AuNRs@T18-DNA@Ag (directional building block, black curve) and of a single anisotropic directional nanoassembly (red curve), as investigated by dark-field microscope (DFM)-SERS (λlaser = 633 nm). The characteristic SERS peaks from A and T are indicated.

