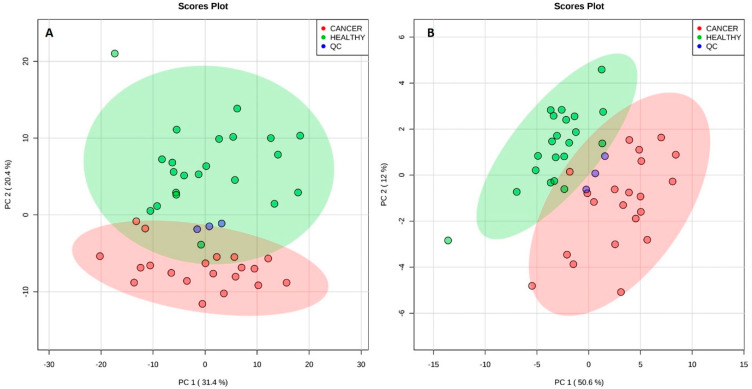
Figure 3.
Principal component analysis (PCA) scores plot for plasma analysis in positive ion mode (A) and in negative ion mode (B). Segregation was observed for both modes between cancer and healthy individuals. Quality control (QC) samples (pool of all the samples) are also plotted. The explained amount of the total variance of the full data set is shown for each principal component (PC1-2).

