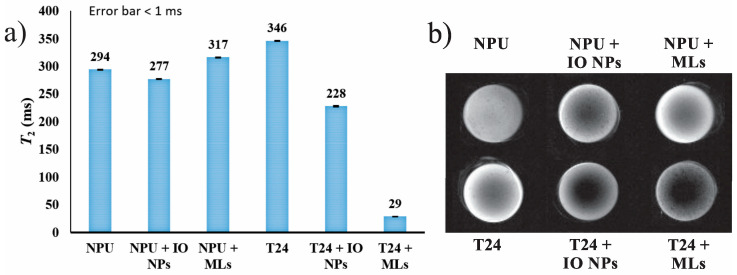
Figure 3.
Magnetic resonance imaging (MRI) measurements of MLs in NPU and T24 cells. (a) T2 relaxation times and (b) T2-weighted image taken from cell pellets following 24 h of incubation with HCA-IO NPs or MLs (DOPC/Chol formulation). Untreated cells were used as controls. Imaging parameters were TE/TR = 13/2000 ms (inter-echo time/repetition time).

