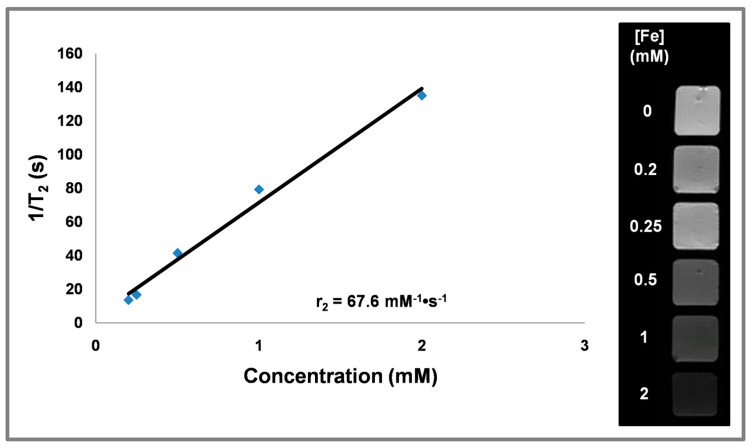
Figure 6.
Plot of transverse relaxation rate (1/T2) over the Fe concentration of PEGylated CF@MF NPs, measured at 9.4 T (left). Transverse relaxivity (r2) corresponds to the slope of the regression (black line). Representative T2-weighted MRI image of a phantom containing solutions of PEGylated CF@MF NPs at different concentrations (right).

