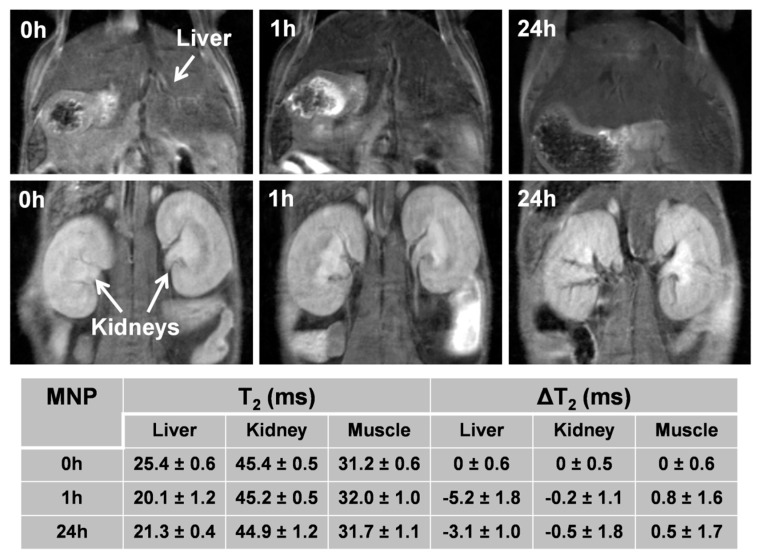
Figure 8.
RepresentativeT2-weighted MR images at different experimental times after the intravenous injection of PEGylated CF@MFNPs of liver (top) and kidneys (bottom). T2 and ΔT2 values of liver, kidneys and muscle at different times after the intravenous injection of PEGylated CF@MF NPs. Values correspond to the mean ± standard deviation (n = 3).

