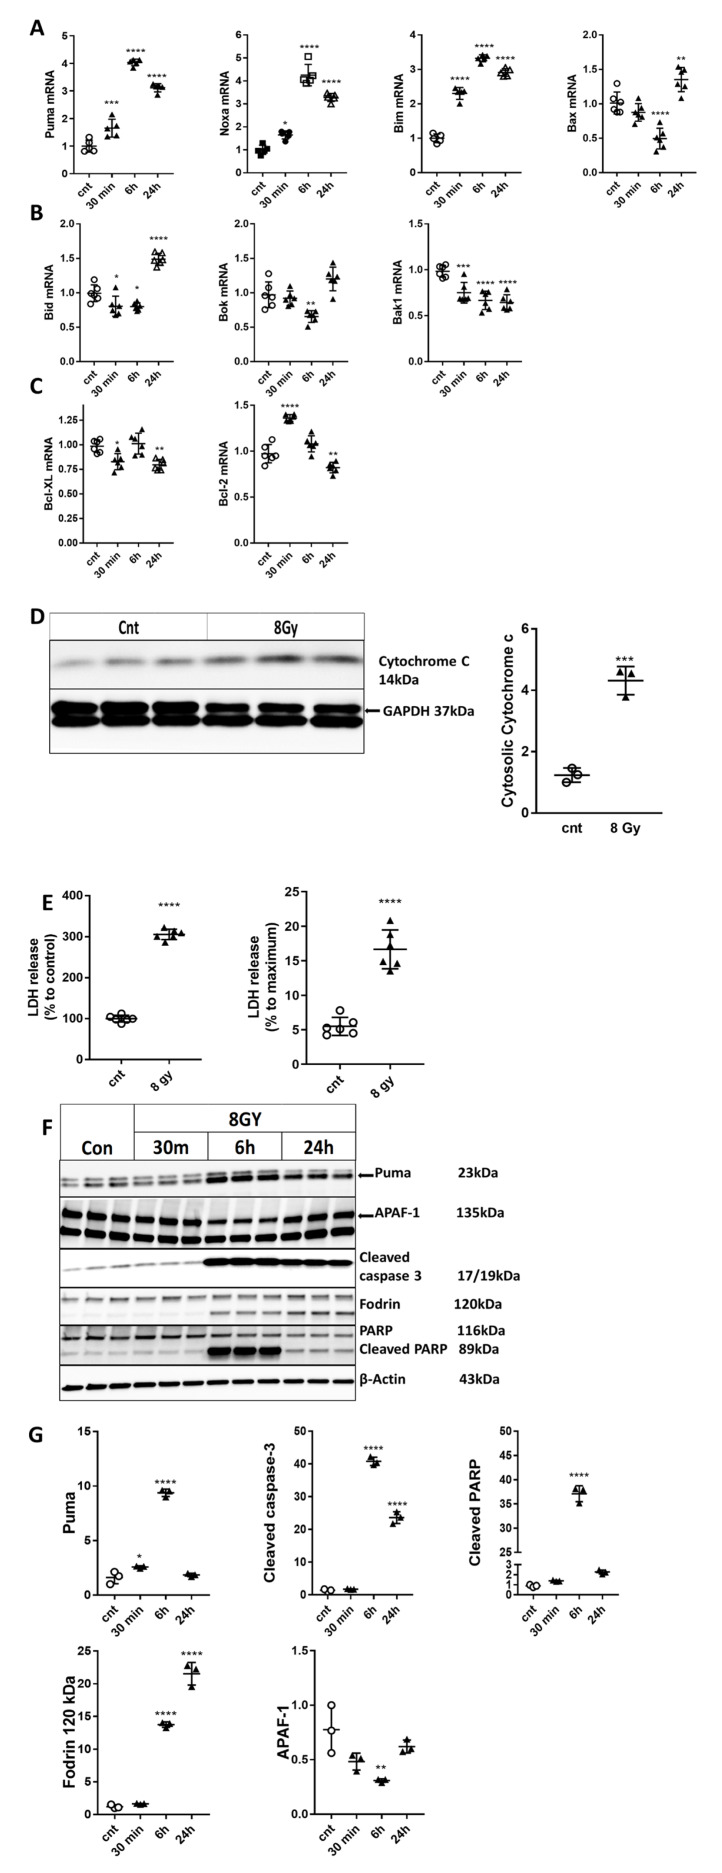
Figure 3.
IR up-regulated select pro-apoptotic members of the Bcl-2 family, mitochondrial membrane permeabilization, and release of pro-apoptotic molecules. Neurons were collected at 30 min, 6 h, and 24 h after 8 Gy irradiation. Total RNA was used for qPCR analysis. qPCR quantification of Puma, Noxa, Bim, and Bax (A); Bid, Bok, and Bak1 (B), and Bcl-xL and Bcl-2 (C) mRNA levels in a representative experiment. The experiment was repeated three times. N = 5/group in each experiment, with two technical replicates. Data represent the mean ± SD of one-way ANOVA and Tukey post-hoc analysis, * p < 0.05, ** p < 0.01, *** p < 0.001, **** p < 0.0001 vs. control RCN. RCNs were collected at 24 h after 8 Gy irradiation. Cytosolic fractions were separated by SDS-polyacrylamide gel and immunoblotted with antibodies against cytochrome c and GAPDH. Image of the representative experiment (D). Protein levels were quantified by densitometry, normalized to approximately a 37 kDa band of GAPDH, and presented as a fold change compared to control levels. The experiment was repeated 3 times with similar results, n = 3/group in each experiment. Data represent the mean ± SD. Statistical significance assigned by one-tailed t-test, ***p < 0.001 versus control. Irradiation induces neuronal cell death. Neurons were irradiated with 8 Gy. Twenty-four hours later, LDH release was measured. Data are expressed as a percentage of control untreated neurons as well as completely permeabilized cells (100% cell death) (E). The experiment was repeated six times with similar results, n = 6/group. Data represent the mean ± SD. Statistical significance was assigned by the one-tailed t-test, p < 0.0001 vs. control. Rat cortical neurons (RCNs) were collected at 30 min, 6 h, and 24 h after ionizing radiation (IR). Whole-cell lysates were separated by SDS-polyacrylamide gel and immunoblotted with antibodies against Puma, cleaved caspase-3, poly (ADP-ribose) polymerase family, member 1 (PARP), cleaved α-fodrin, and apoptotic peptidase activating factor 1 (Apaf-1). Image of a representative experiment (F). Protein levels were quantified by densitometry, normalized to β-actin, and presented as a fold change compared with untreated control levels (G). The experiment was repeated three times. N = 3/group in each experiment. Data represent mean ± SD of one-way ANOVA and Tukey post-hoc analysis, * p < 0.05, ** p < 0.01, *** p < 0.001, **** p < 0.0001 vs. control RCN.

