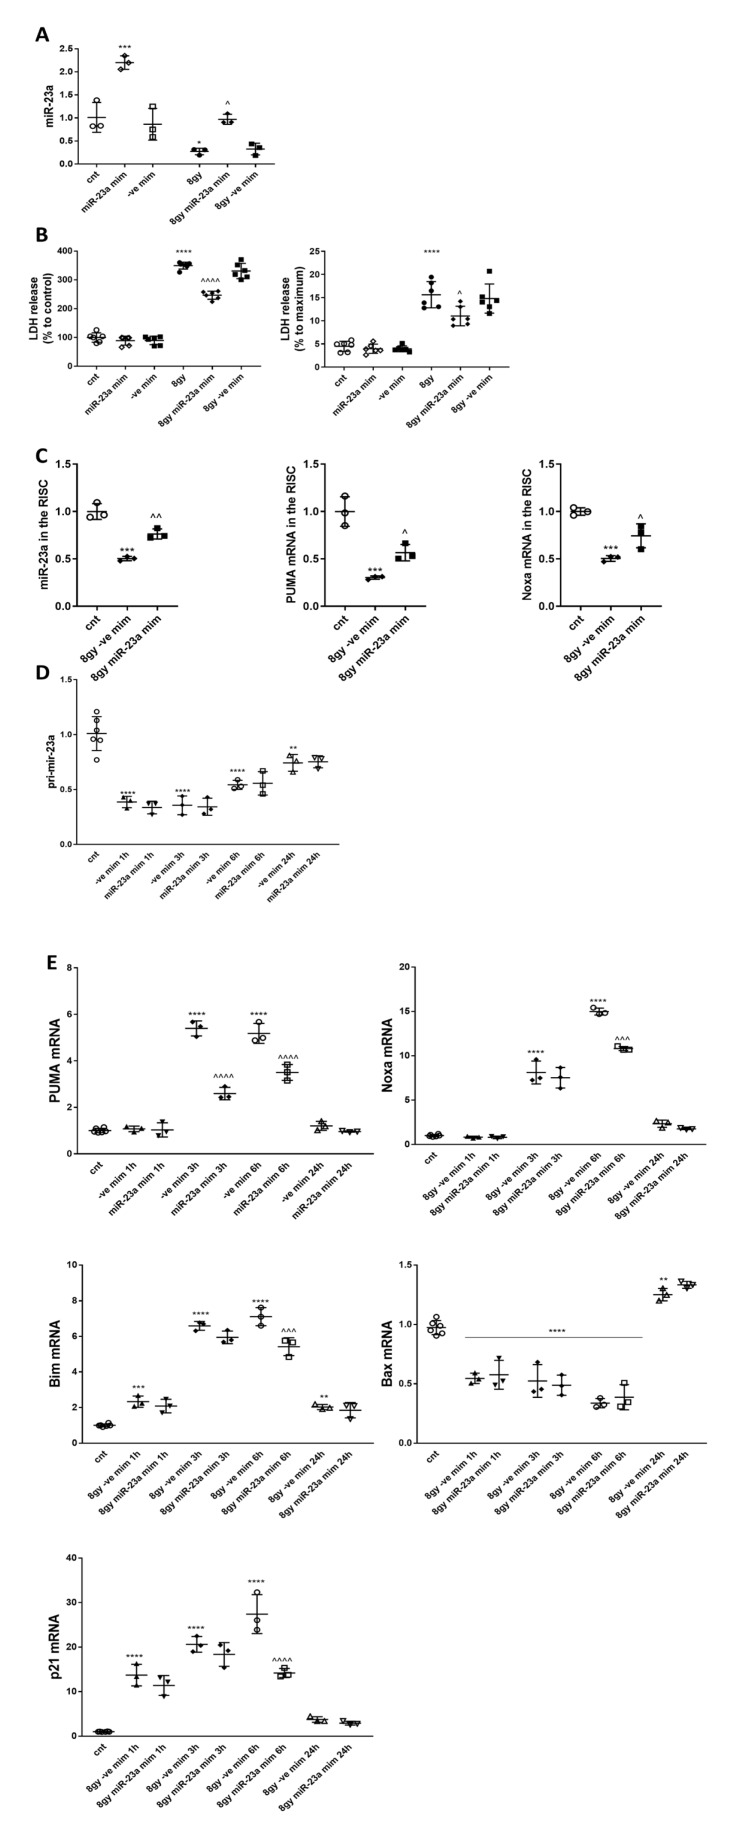
Figure 5.
miR-23a-3p mimic reverses the decrease of endogenous miR-23a-3p in irradiated primary cortical neurons and attenuates neuronal cell death. RCNs were transfected with miR-23a-3p mimics and negative control mimics before irradiation. At 3 h after exposure to 8 Gy, neurons were harvested for RNA isolation. qPCR quantification of miR-23a-3p in a representative experiment (A). The experiment was repeated two times. N = 3/group in each experiment with 2 technical replicates. Data represent mean ± SD. Statistical significance assigned by one-way ANOVA and Tukey post hoc analysis; * p < 0.05, *** p < 0.001 vs. control RCN; ^ p < 0.05 vs. irradiated negative control mimics. LDH release was measured at 24 h after irradiation as a percentage of control untreated neurons as well as completely permeabilized cells (100% cell death). Analysis of a representative experiment (B). The experiment was repeated four times with similar results, n = 6/group in each experiment. Data represent mean ± SD. Statistical significance assigned by one-way ANOVA and Tukey post hoc analysis, * p < 0.05, *** p < 0.001, vs. control RCN. ^ p < 0.05, ^^^^ p < 0.0001 vs. negative control mimic transfected cells (-ve mim) RCN. RCNs were treated as described above and harvested 3 h after 8 Gy irradiation. Lysates from each sample were subjected to RNA-binding protein immunoprecipitation (RIP) using Ago2 antibodies, followed by qPCR analysis for levels of miR-23a-3p, Puma, and Noxa in the RISC. Analysis of a representative experiment (C) n = 3/group in each experiment with 2 technical replicates. Data represent mean ± SD. Significance assigned by one-way ANOVA and Tukey post hoc analysis, miR-23a-3p *** p = 0.0001 vs. control RCNs; ^^ p < 0.0039 vs. 8 Gy + miR-ve mimic; Puma *** p = 0.0004 vs. control RCNs; ^ p < 0.0471 vs. 8 Gy + miR-ve mimic; Noxa *** p = 0.0006 vs. control RCNs; ^ p < 0.0228 vs. 8 Gy + miR-ve mimic. IR causes the down-regulation of miR-23a-3p at the transcription stage. qPCR quantification of pri-miR-23a-3p. Analysis of a representative experiment (D). Data represent the mean ± SD of one-way ANOVA and Tukey post-hoc analysis, n = 6 for the control group, n = 3 for all other groups with 2 technical replicates in each experiment; * p < 0.05, ****p < 0.0001 vs. control RCN. miR-23a-3p mimic attenuates the irradiation-induced elevation of Puma, Noxa, and Bim in primary cortical neurons. RCNs were transfected with miR-23a-3p mimics and negative control mimics before irradiation. Neurons were harvested for RNA isolation at 1 h, 3 h, 6 h, and 24 h after exposure to 8 Gy. qPCR quantification of Puma, Noxa, Bim, and Bax and p21. Analysis of a representative experiment (E). The experiment was repeated three times, n = 6 for control, n = 3 for all other groups in each experiment with 2 technical replicates. Data represent mean ± SD. Statistical significance assigned by one-way ANOVA and Tukey post hoc analysis, ** p < 0.01, *** p < 0.001, **** p < 0.0001 vs. control RCN, ^^^ p < 0.001, ^^^^ p < 0.0001 vs. negative control mimic transfected cells (-ve mim) RCN.

