Figure 3.

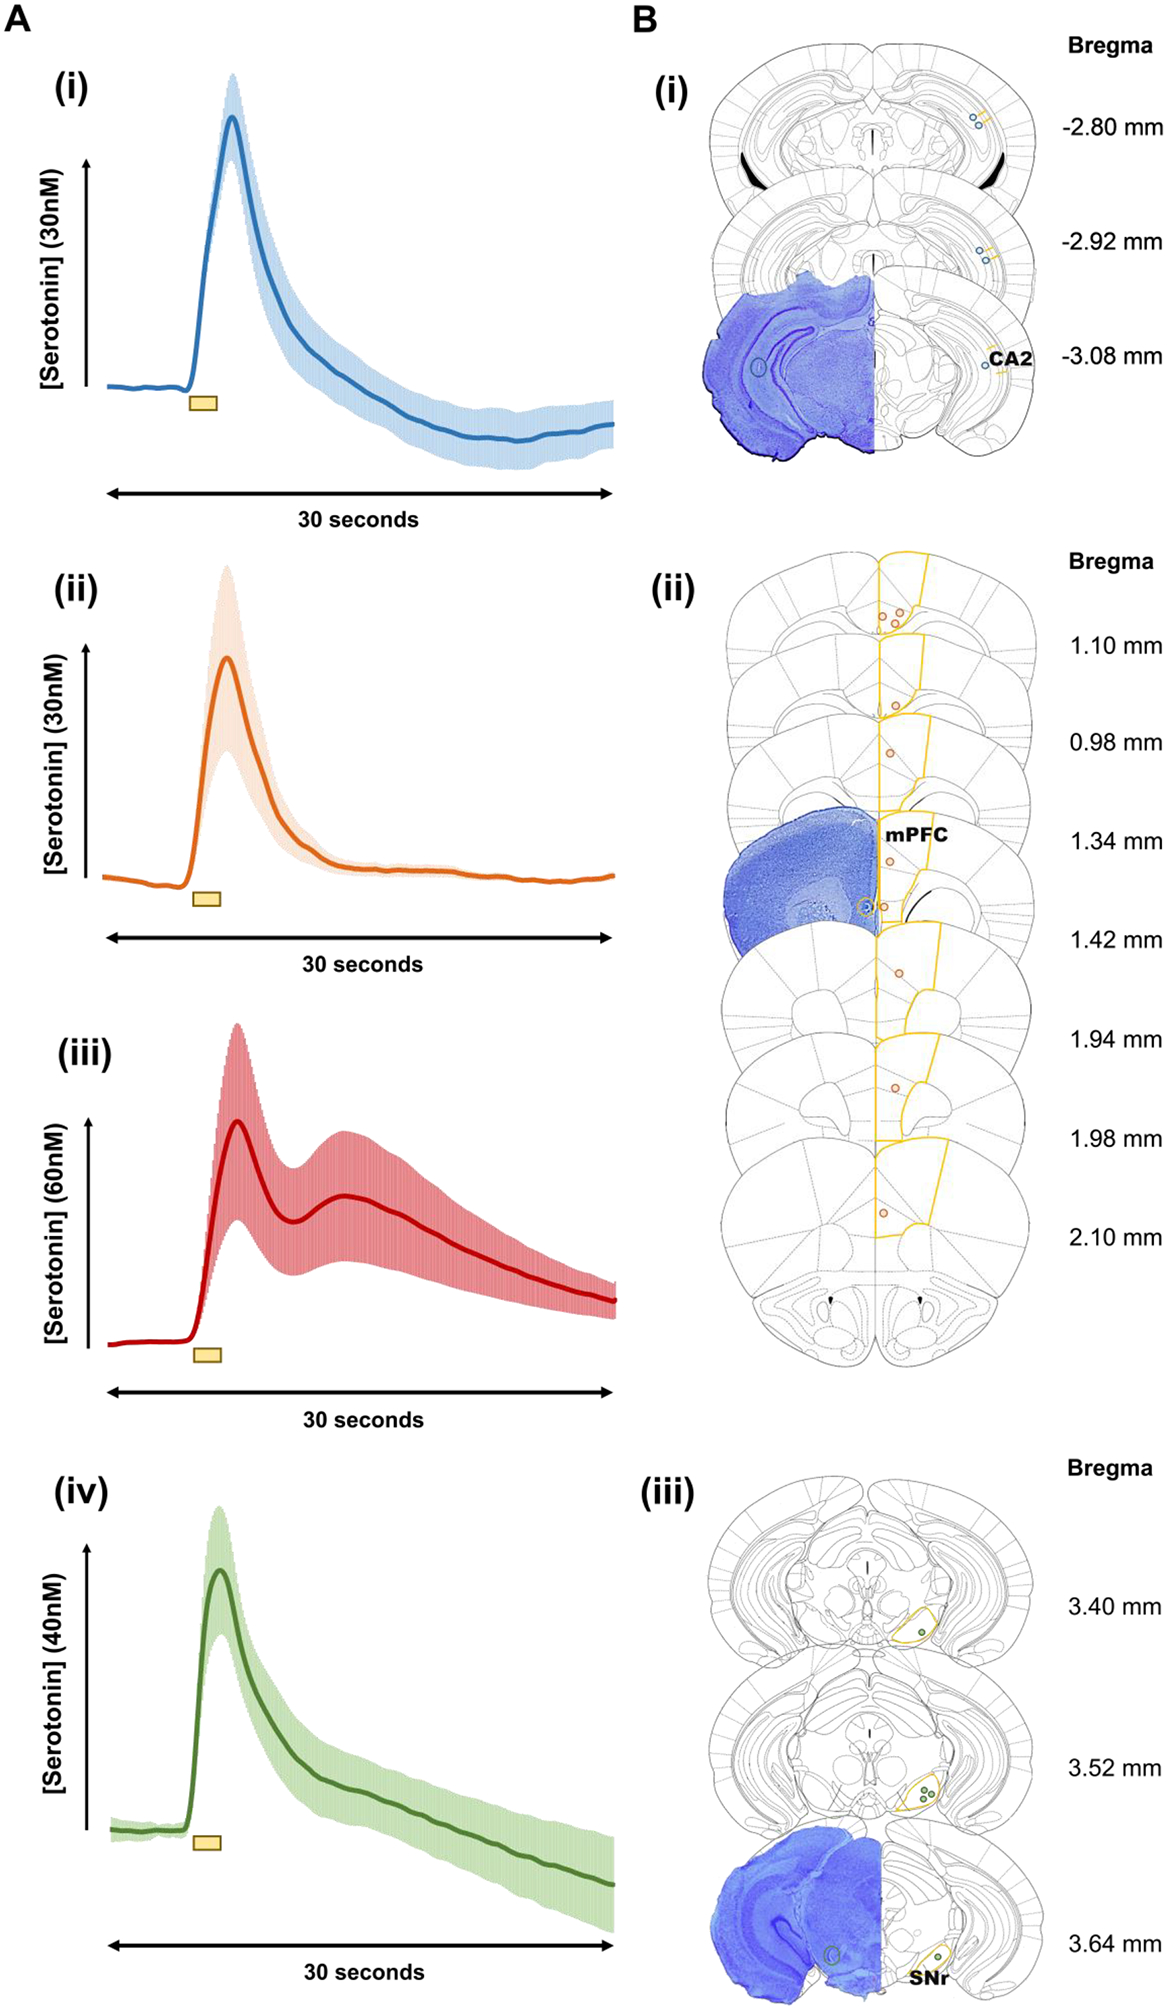
(A) Averaged [Serotonin] – time profiles (n=5 ± SEM) i) CA2, ii) mPFC single peak response, and iii) mPFC double peak response, and iv) SNr. Yellow bars beneath the plot denote the stimulation period (2 s). (B) Thionin stained representative brains displayed on the left with a colored circle denoting the actual placement of the CFM. On the right, yellow lines represent the outlines of the i) CA2 ii) mPFC, and iii) SNr regions. Blue, orange, and green circles denote the placement of the CFM in each individual mouse, for the CA2 (n=5), the SNr (n=5), and the mPFC (n=10), respectively. Coordinates with respect to Bregma are shown to the right of each coronal slice. Region specific coordinates are explained in the methods section. (n=number of animals)
