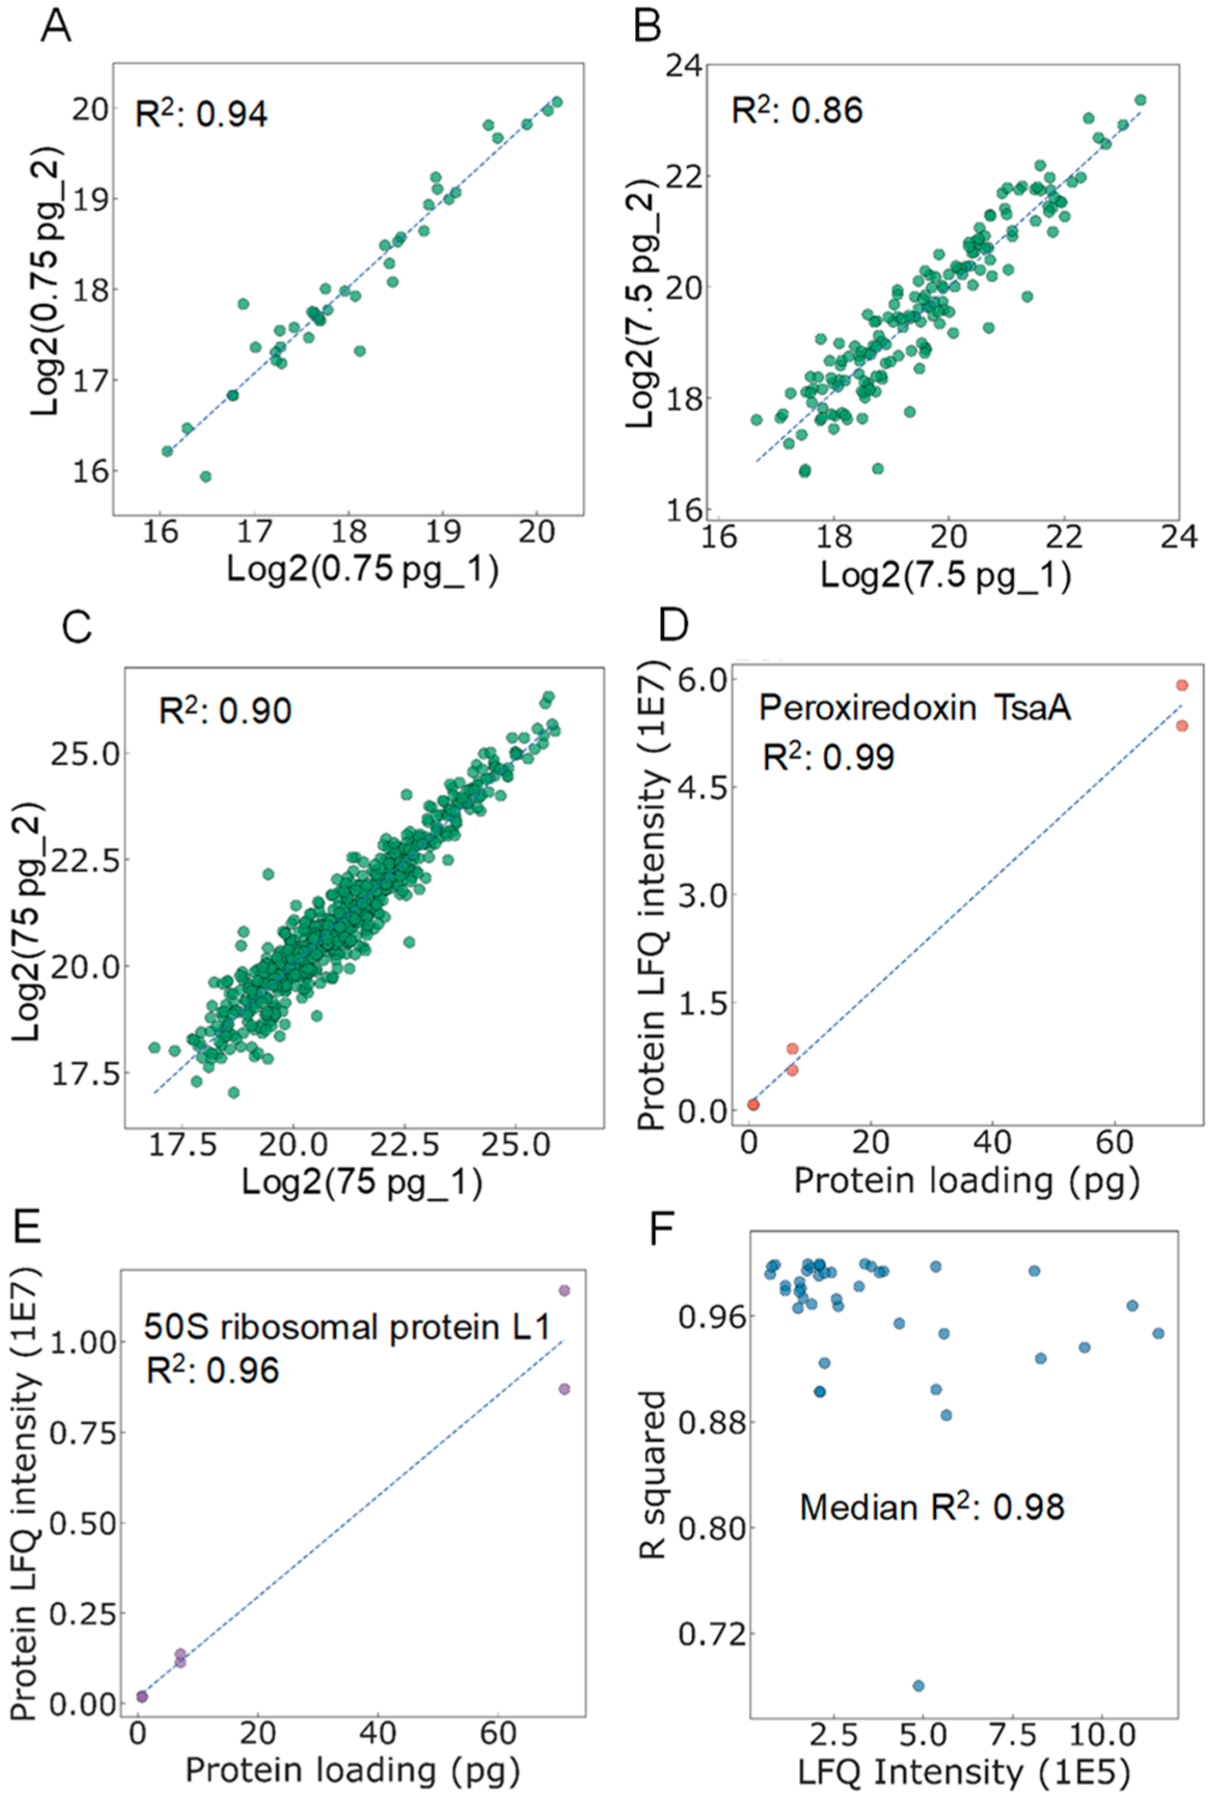
Figure 4.

Pairwise correlation of protein LFQ intensities between samples containing the same loading amounts, including (A) 0.75 pg, (B) 7.5 pg, and (C) 75 pg tryptic digests of S. oneidensis. Linear correlations between protein loading amount and protein LFQ intensities for (D) a high-abundance protein (Peroxiredoxin TsaA) and (E) a low-abundance protein (50S ribosomal protein L1). (F) Distribution of R2 for the commonly identified 41 proteins as a function of protein LFQ intensities.
