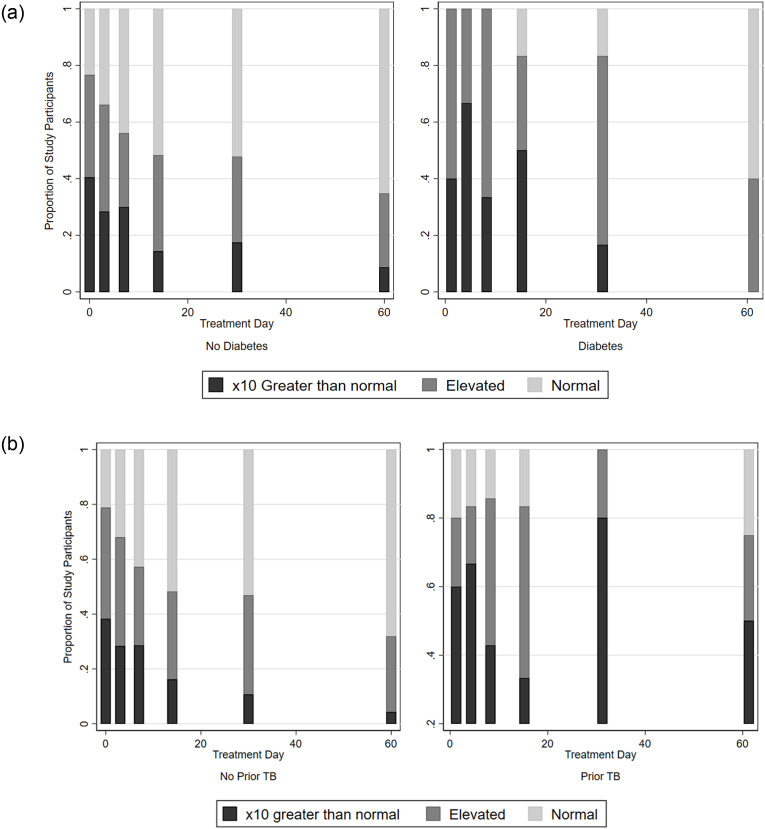
Fig 3. Total time spent coughing by prior tuberculosis diagnosis and diabetes co-morbidity.
Shown here are stacked bar graphs showing the proportion of individuals in each group with extremely elevated (x10 greater than normal), elevated (greater than normal), or normal (< = 0.6 coughs/hour) cough as of a given study visit. Individuals with prior TB and individuals with diabetes co-infection were more likely to have extremely elevated or elevated cough at later study visits.

