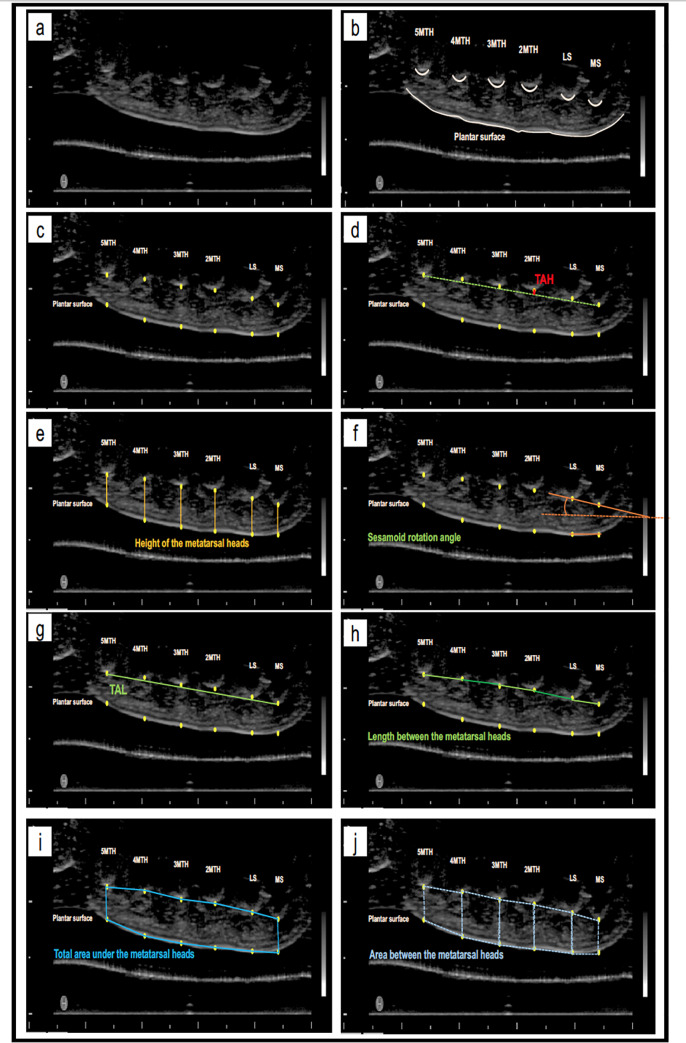
Fig 2. Ultrasound image analysis.
a) ultrasound image of the transverse arch; c) marking the lowest points of MS, LS, 2MTH, 3MTH, 4MTH, 5MTH and their plantar surface projections; d) TAH is red line; e) the height of the metatarsal heads in orange lines; f) SRA in orange angle; g) TAL in green line; h) the length between each metatarsal head in green lines; i) the total area under the metatarsal heads marked by blue lines; j) the area between each two metatarsal heads marked by dotted blue lines.

