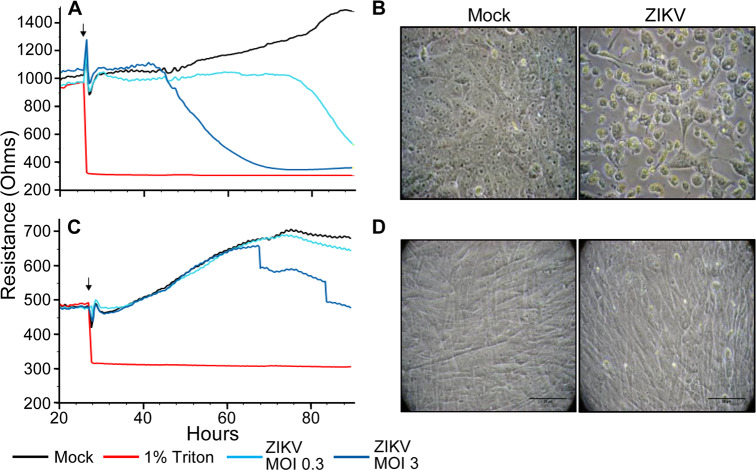
Fig 2.
Electrical impedance of ZIKV-infected Vero (A) and HSerC (C). Cells were added to 96-well ECIS plates and allowed to grow for 24h to create monolayers. Cells were then treated, at time indicated with small vertical arrows, with media alone (positive control; black line), 1% Triton X-100 (negative control; red), or with ZIKV at MOI of 0.3 (teal) or 3.0 (dark blue) and cultures maintained with continuous impedance monitoring for another 66–80 hours. Values represent the averages obtained from 8 wells for each condition, and HSerC were analyzed twice. Micrographs of Vero (B) and Sertoli (D) cells at 72 hpi demonstrating observable CPE.

