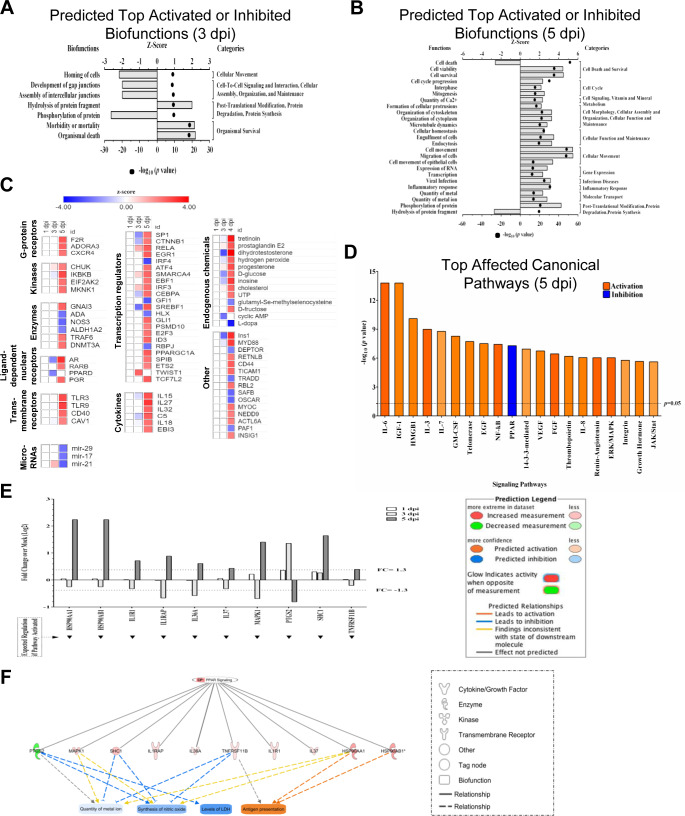
Fig 4. IPA-predicted activation and inhibition of bio-functions, upstream molecules, and canonical pathways.
(A) Top bio-functions and predicted activation or inhibition Z-Scores (upper x-axis) and Log10 p-values (lower x-axis) are indicated at 3 dpi and (B) 5 dpi. Activation is indicated by positive Z-Score and the inhibited bio-functions are indicated by negative Z-scores. Major bio-function categories are indicated at right. (C) Top upstream molecules and prediction of their activation or inhibition based on Z-Scores. (D) Top affected canonical pathways with Log10 p-value indicated at the top. Orange corresponds to activation, and blue corresponds to inhibition, with the degree of coloration corresponding to Z-Score. (E) ZIKV-induced inhibition of selected proteins within the PPAR signaling pathway as a function of time post-infection. Note that by 5 dpi, all proteins are dysregulated ≥ 1.3-fold. (F) Predicted effects of indicated PPAR pathway proteins on various bio-functions.

