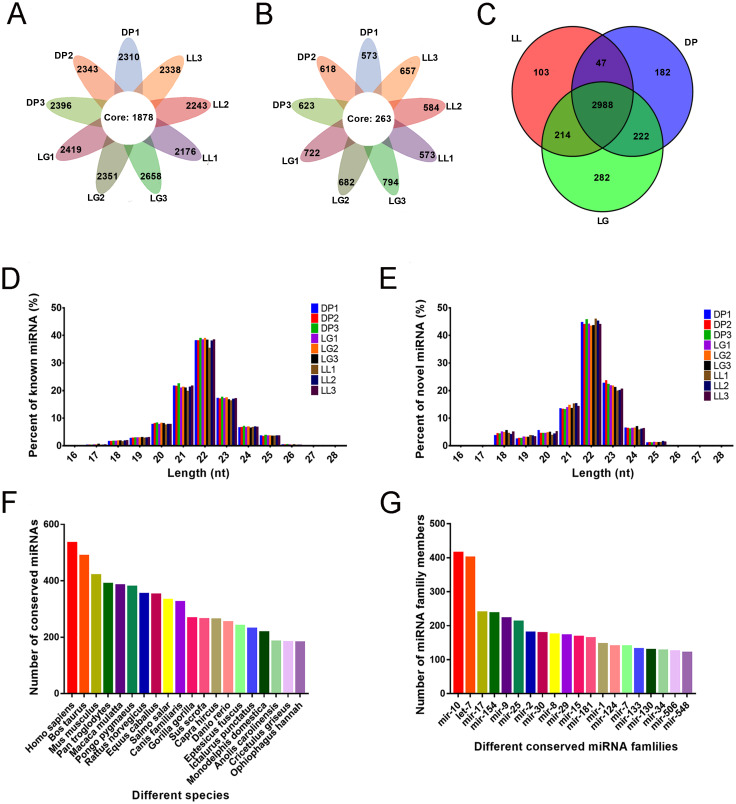
Fig 1. Identification and family analysis of known and novel miRNAs at different developmental stages.
A-B present statistics of known and novel miRNAs identified from the 9 libraries. The core circle represents the total number of miRNAs in the 9 libraries. A shows the number of known miRNAs in the 9 libraries. B shows the number of novel miRNAs. C shows a Venn diagram of miRNAs at the three different stages. D-E show the distributions of the lengths of known and novel miRNAs. D shows the known miRNA length distribution, while E shows the novel miRNA length distribution. F shows the statistics of the number of all miRNAs in some species during the three stages. G shows the statistics of the number of miRNAs in different miRNA families.

