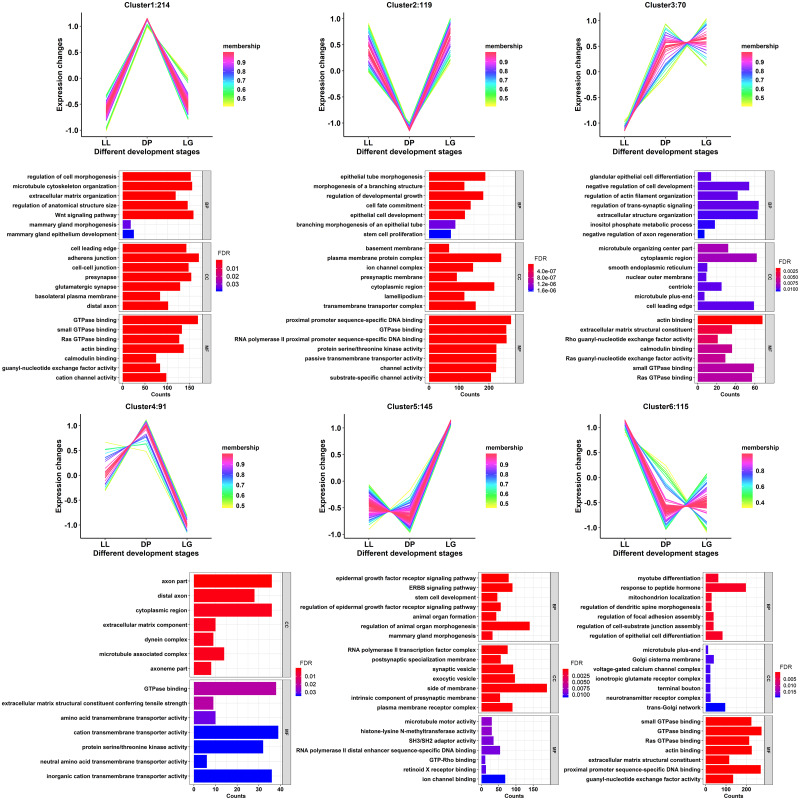
Fig 3. Expression pattern analysis of differentially expressed miRNAs.
Clusters 1–6 show the cluster diagrams of all differentially expressed miRNA expression patterns and the GO enrichment analysis diagram of their target genes. The membership values indicate the degree to which data points belong to a cluster. The values of expression change indicate the expression level after normalizing the TPM values of miRNAs by the z-score method.

