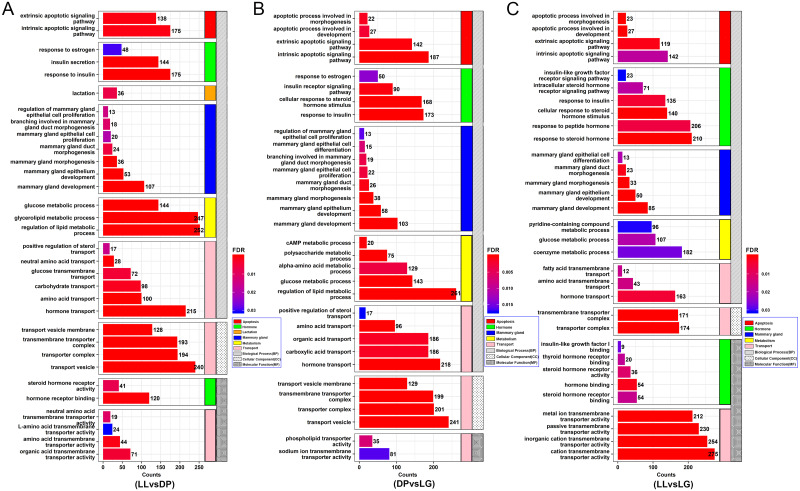
Fig 4. GO analysis of target genes corresponding to differentially expressed miRNAs.
A-C show GO annotation maps of the target genes corresponding to differentially expressed miRNAs in different groups. The horizontal axis of the bar chart represents the number of target genes associated with each GO term, the vertical axis represents different GO terms, and the different colors of the bar chart represent FDR values.

