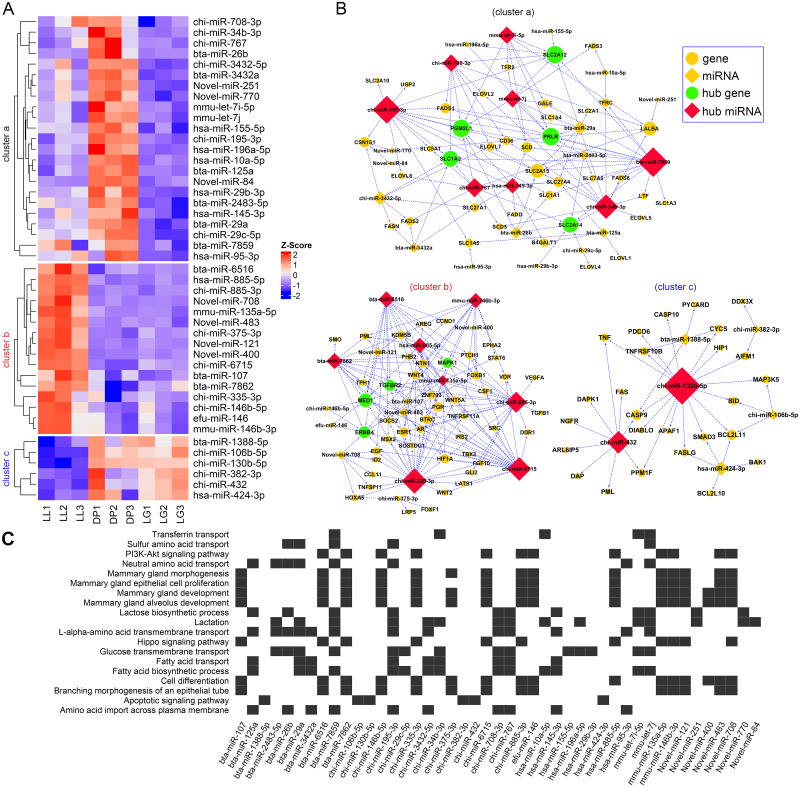
Fig 6. Network between differentially expressed miRNAs and their potential target genes.
A shows a heat map of the expression profiles of 45 differentially expressed miRNAs at the three developmental stages. B shows a regulatory network of three miRNAs and potential target genes. The cluster a network contained 62 nodes and 123 regulatory relationships (edges), cluster b contained 63 nodes and 160 regulatory relationships, and cluster c contained 32 nodes and 39 regulatory relationships. The yellow circles and diamonds represent common genes and miRNAs, respectively. Green circles represent the hub target genes, and red diamonds represent the hub miRNAs. C shows a heat map of the relationship between GO terms or KEGG pathways and miRNAs.

