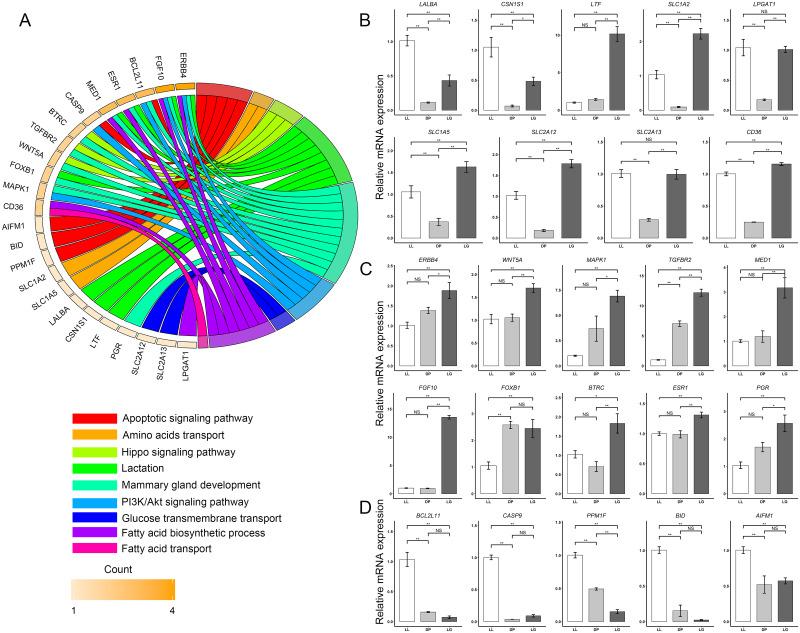
Fig 7. Quantitative analysis of target gene expression in three networks.
A Chord plots of the relationships between target genes and GO terms or KEGG pathways. B shows a histogram of the relative expression of 9 genes in cluster a at the three developmental stages (LL, DP and LG). C shows a histogram of the relative expression of 9 genes in cluster b at the three developmental stages (LL, DP and LG). D shows a histogram of the relative expression of 9 genes in cluster c at the three developmental stages (LL, DP and LG). * indicates a statistically significant difference between groups (P < 0.05), ** indicates a highly significant difference between groups (P < 0.01), and NS (not significant) indicates that there is not a statistically significant difference between groups.

