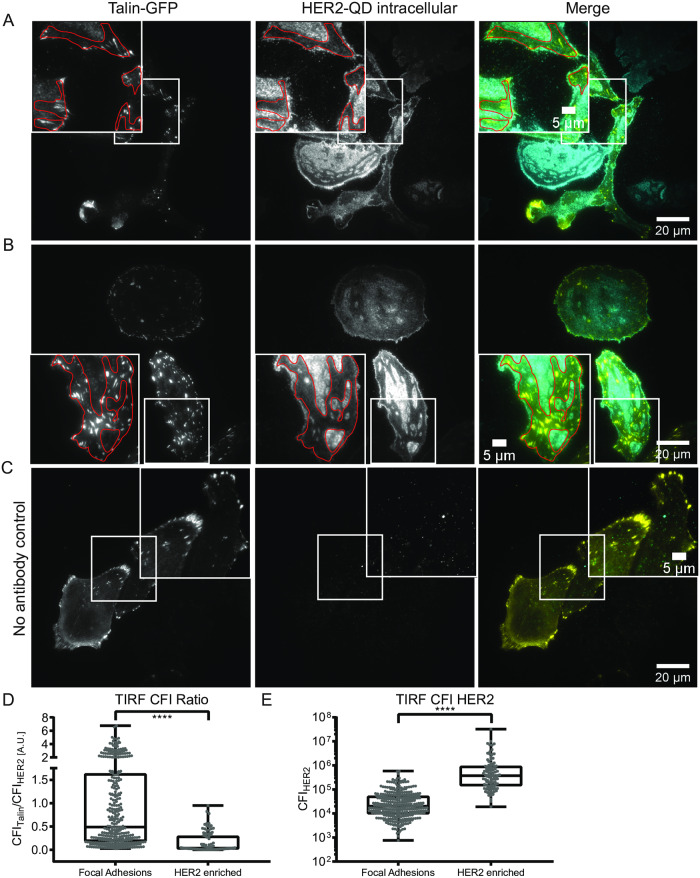
Fig 3. Analysis of intracellular HER2 labeling and co-labeling with talin confirms HER2 expression at the cell substrate interface.
(A and B) Total internal reflection fluorescence (TIRF) microscopy of SKBR3 cells transduced with talin-GFP on glass-bottom dishes analyzed with a 100x oil TIRF optimized objective. The intracellular domain of HER2 was labeled with strept-QD via biotinylated anti-HER2 antibody coupled to strept-QD (HER2-QD). Outlined regions indicate HER2-low expression areas. (C) Control experiment using the same protocol as A and B, but without anti-HER2 antibody. (D) Box plot graph displaying the ratios of talin-GFP to HER2-QD corrected integrated fluorescence intensities (CFI) measured at focal adhesions (left) and HER2-enriched regions (right). (E) Box plot graph displaying the CFI for HER2-QD measured at focal adhesions or at HER2-enriched regions. (D, E) **** for p < 0.001, unpaired, two-tailed t-test, n = 339 for talin spots and n = 95 for HER2-enriched regions, obtained from 16 different cells expressing variable amounts of talin. Box plot graphs show min to max representations with indicated median value with each point representing one measurement. Colors in merged images: yellow for GFP and cyan for strept-QD. Scale bars: 20 μm and 5 μm for insets.

