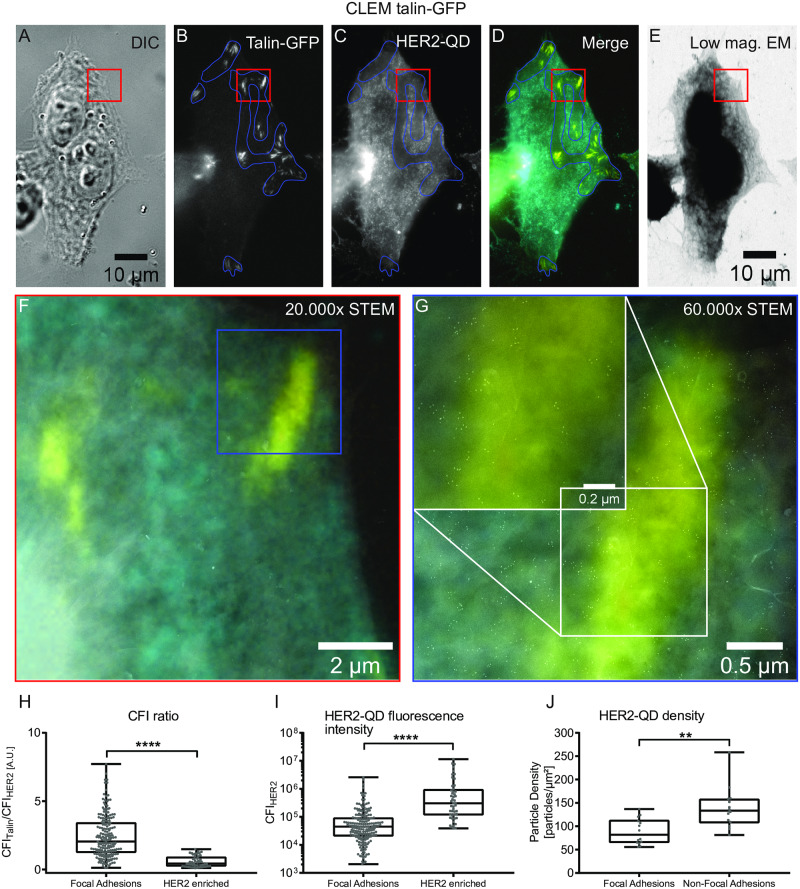
Fig 4. Correlative light- and electron microscopy (CLEM) of intracellularly HER2-QD, and talin-GFP at focal adhesions.
(A-E) Example image of a SKBR3 cell grown on a silicon nitride window of a silicon microchip suitable for correlative light- and electron microscopy. Shown are DIC (A), fluorescence images for talin-GFP (B), HER2-QD (C), the fluorescent channel overlay image (D), and an 800x low magnification (low mag.) bright field scanning transmission electron microscopy (STEM) image (E) of the same cell. HER2 low regions are outlined in blue. The rectangle outlined in red indicates the magnified region shown in (F) acquired with dark field STEM and overlaid with the corresponding magnified merge fluorescent image. (G) displays a zoom of the highlighted region in blue in (F). A further magnified region is shown in the inlet (white rectangle). Note that the talin-positive region shows a lower abundance of HER2-QDs (yellow stripe). (H) Box plot graph displaying the ratios of talin-GFP to HER-QD CFIs measured at focal adhesions (left) and HER2-enriched regions (right). (I) Box plot graph displaying the CFI for HER2-QD measured at focal adhesions or at HER2-enriched regions. **** for p < 0.001, unpaired, two-tailed t-test, n = 192 for talin spots and n = 48 for HER2-enriched regions. (J) Box plot graph displaying the HER2-QD density measured from the STEM image for focal adhesion versus non-focal adhesion regions. ** for p < 0.01 unpaired, two-tailed t-test, n = 14 for both talin spots and non-talin spots. Graphs display min to max representations with indicated median value. Each point represents one CFI measurement (H and I) or the particle density of one analyzed image (J). Colors in merged images: yellow for GFP and cyan for HER2-QD. Scale bars: 10 μm in (A), 2 μm (F), 0.5 μm and 0.2μm for (G).

