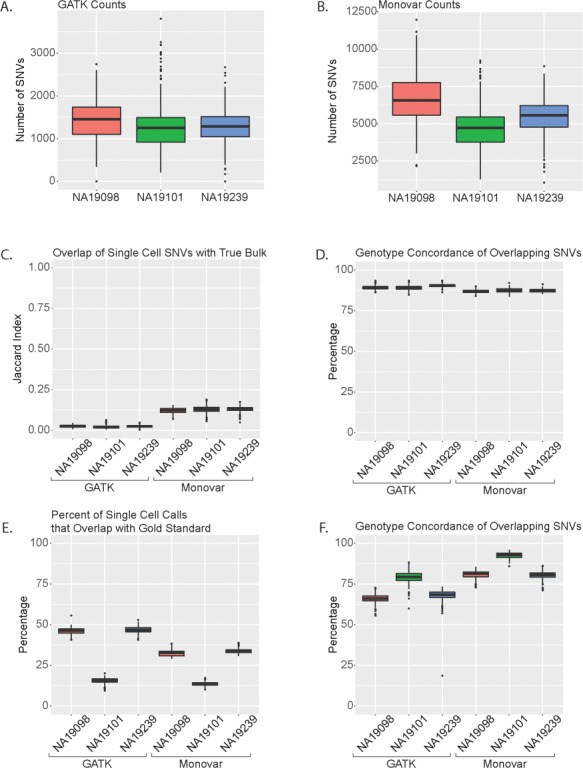
Figure 3.

Analysis of single cell SNV calls. Number of SNVs in individual cells called using (A) GATK and (B) Monovar. (C) Jaccard Index of overlap between single cell SNVs and True Bulk. (D) Percentage of overlapping SNVs between single cell samples and True Bulk with genotype concordance. (E) Percentage of single cell SNVs that overlap with gold standard. (F) Percentage of overlapping genotype concordant SNVs between single cells and gold standard.
