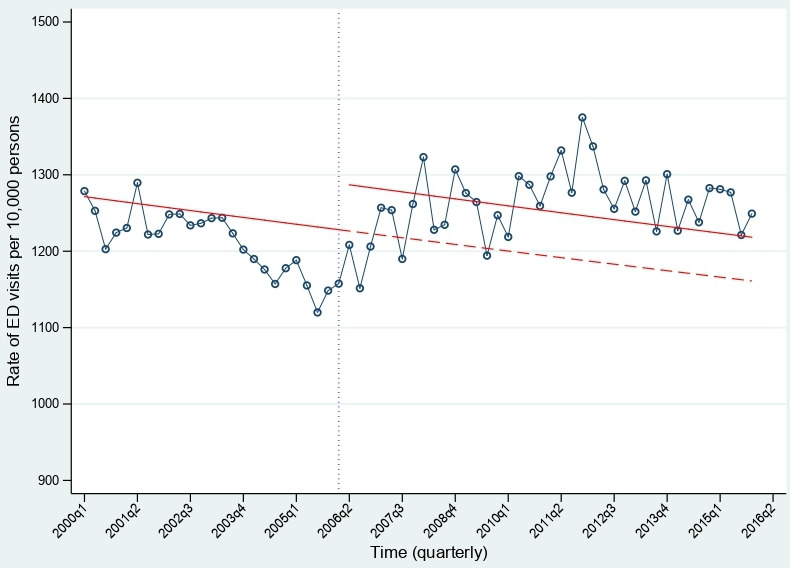
Figure 3.

The trend in the rate of ED visits among the inhabitants 65+ years in the rest of Stockholm County from 2000q1 to 2015q4. The circles represent the observed rate of ED visits per 10 000 persons, the vertical line represents the point where integrated care (IC) was implemented in Norrtälje. The solid line represents the temporal trend, and the step at the postintervention period is the estimated effect and the dashed red line represents the counterfactual trend if IC was not implemented in Norrtälje. ED, emergency department.
