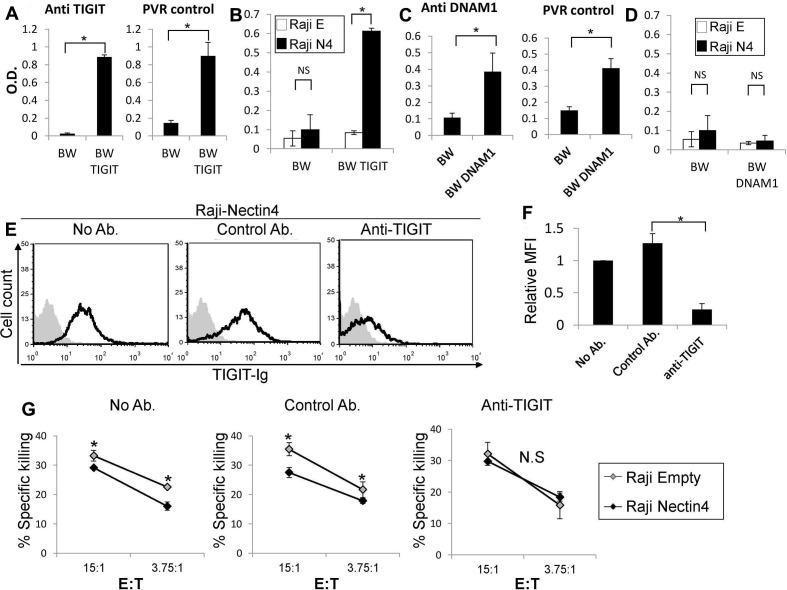
Figure 2.
Nectin4 inhibits NK cytotoxicity via TIGIT. (A, C) IL2 secretion by parental BW (A, C), (A) BW-TIGIT and (C) BW-DNAM1 cells. IL2 secretion was determined by ELISA (od 650 nm) following incubation with control anti-TIGIT or anti-DNAM1 antibodies (left in a and C) or with PVR expressing cells (right in a and C). (B, D) IL2 secretion of parental BW (B, D), (B) BW-TIGIT and (D) BW-DNAM1 cells. IL2 secretion was determined by ELISA (od 650 nm) following incubation with Raji cells transfected either with an empty vector (Raji E) as a control, or with Nectin4 (Raji N4). Figure shows one representative experiment out of 3 performed. *P<0.05. (E) FACS staining of Raji cells overexpressing Nectin4 with TIGIT-Ig. TIGIT-Ig was preincubated with no antibody (left), with a control mAb (anti-CD99 mAb clone 12E7, middle) or with anti-TIGIT blocking antibody (mAb #4 generated as described previously,14 right). Black line histograms represent TIGIT-Ig binding. Gray filled histograms represent background staining of the secondary antibody only. (F) Mean fluorescence intensity (MFI) values of the TIGIT-Ig staining shown in (E) relative to NO antibody staining, *p<2×10⁻⁴. (G) [35S] methionine-labeled Raji cells transfected either with an empty vector as control (Raji empty—gray) or with Nectin4 (Raji Nectin4—black), were incubated for 5 hours with NK cells. NK cells were preincubated with no antibody (left), with a control antibody (anti-CD99 mAb clone 12E7, middle) or with an anti-TIGIT antibody (mAb #4 generated as described previously,14 right). The effector to target (E:T) ratios are indicated on the x-axis. Figure shows one representative experiment out of three performed. Shown is the relative average killing ±SD, *p<0.05. FACS, fluorescence-activated cell sorting; IL2, interleukin-2; NK, natural killer; NS, not significant.

