Figure 3.

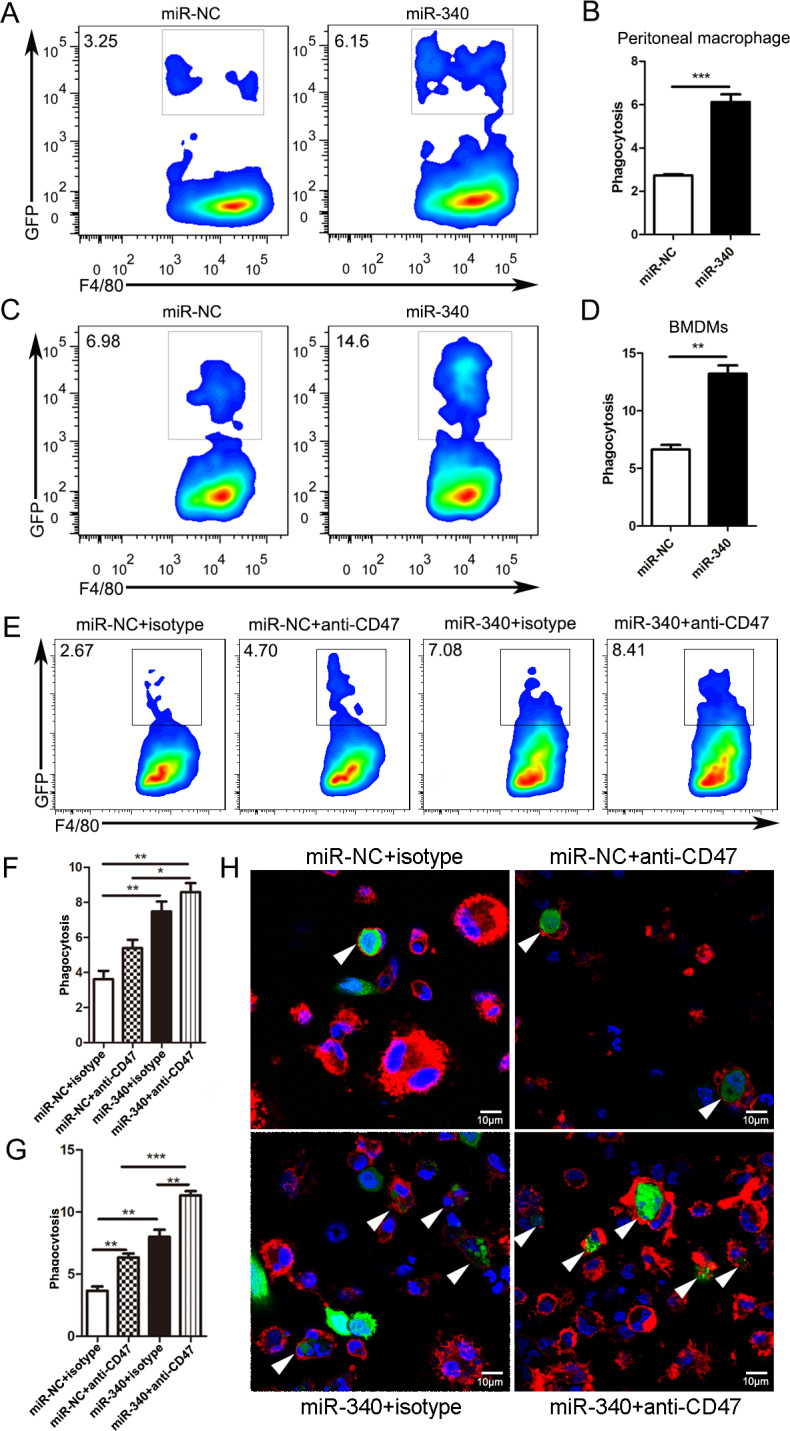
Overexpression of miR-340 promotes phagocytosis of tumor cells by macrophages. Panc02 cells overexpressing miR-NC or miR-340 were incubated with mouse peritoneal cavity-derived macrophages or BMDMs for 4 hours, stained with F4/80-APC antibody and analyzed by flow cytometry. Phagocytosis was described as the percentage of F4/80+GFP+ phagocytosed cancer cells by F4/80+ macrophages. (A, C) Representative plots show the percentage of F4/80+GFP+ macrophages phagocytosing cancer cells among F4/80+ peritoneal cavity-derived macrophages and BMDMs. (B, D) Statistical analysis of phagocytosis of pancreatic cancer cells by both peritoneal cavity-derived macrophages and BMDMs. (E) Representative plots show the percentage of F4/80+GFP+ macrophages phagocytosing cancer cells among F4/80+ BMDMs treated with isotype control or CD47 blocking antibody. (F) Statistical analysis of phagocytosis of Panc02 cells by BMDMs with or without CD47 blocking by flow cytometry. Panc02 cells overexpressing miR-NC or miR-340 were incubated with BMDMs for 4 hours, stained with F4/80-APC antibody and analyzed by immunofluorescence staining. (G) Statistical analysis of phagocytosis of Panc02 cells by BMDMs treated with isotype control or CD47 blocking antibody for immunofluorescence staining. (H) Immunofluorescence staining shows representative images of mouse BMDMs engulfing Panc02 cells with miR-NC and miR-340 overexpression with or without CD47 blocking. The white arrows point to macrophages that phagocytose cancer cells. Macrophages were stained red (F4/80+), cancer cells were green (GFP+) and nuclei were blue (DAPI+). Magnification: 100×. The error bars were shown as mean±SEM and the data were analyzed by two-tailed, unpaired t-test. *P<0.05; **p<0.01 and ***p<0.001. The experiments were performed three times with similar results. BMDM, bone marrow-derived macrophages.
