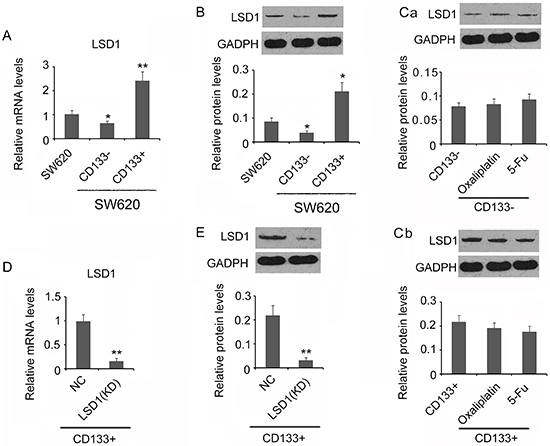
Figure 2. Quantified LSD1 mRNA and LSD1 protein in different cells. A, Relative LSD1 mRNA and protein level (B) in unsorted SW620, CD133−, and CD133+ cells. GADPH is the internal control. Ca and Cb, Relative LSD1 protein level in CD133− and CD133+ cells under oxaliplatin and 5-FU IC50 treatment. GADPH is the internal control. D, Relative LSD1 mRNA in non-treatment control (NC) and LSD1 knockdown CD133+ cells (KD). E, Relative LSD1 protein level in NC control and LSD1 knockdown CD133+ cells (KD). Data are reported as means±SD. A and B, *P<0.05 and **P<0.01 vs SW620 cells; C, no significance; D and E, **P<0.01 vs NC (t-test).

