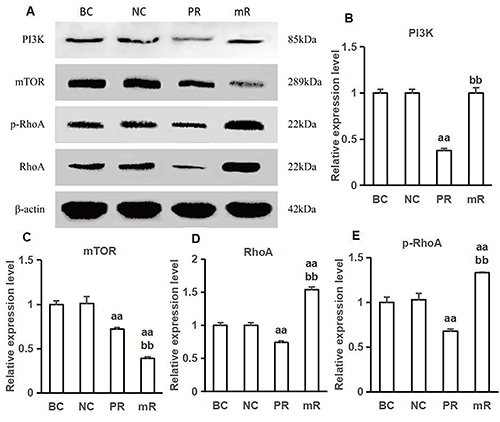
Figure 2. Expression of PI3K, mTOR, RhoA, and p-RhoA proteins in each group. A, Western blot test for the expression of PI3K, mTOR, RhoA, and p-RhoA proteins. B–E, Expression levels of PI3K, mTOR, RhoA, and p-RhoA proteins in each group respectively. aaP<0.01, compared with the blank control group (BC) and the negative control group (NC); bbP<0.01, compared with the PI3K-RNAi group (PR) (ANOVA and LSD t-test). mR: mTOR-RNAi group.

