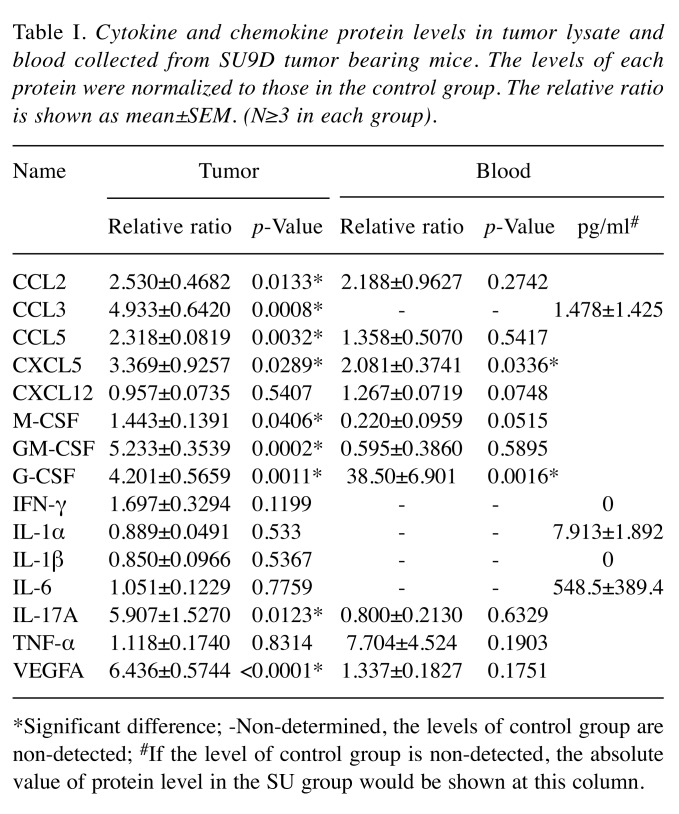
Table I. Cytokine and chemokine protein levels in tumor lysate and blood collected from SU9D tumor bearing mice. The levels of each protein were normalized to those in the control group. The relative ratio is shown as mean±SEM. (N≥3 in each group).
*Significant difference; -Non-determined, the levels of control group are non-detected; #If the level of control group is non-detected, the absolute value of protein level in the SU group would be shown at this column.

