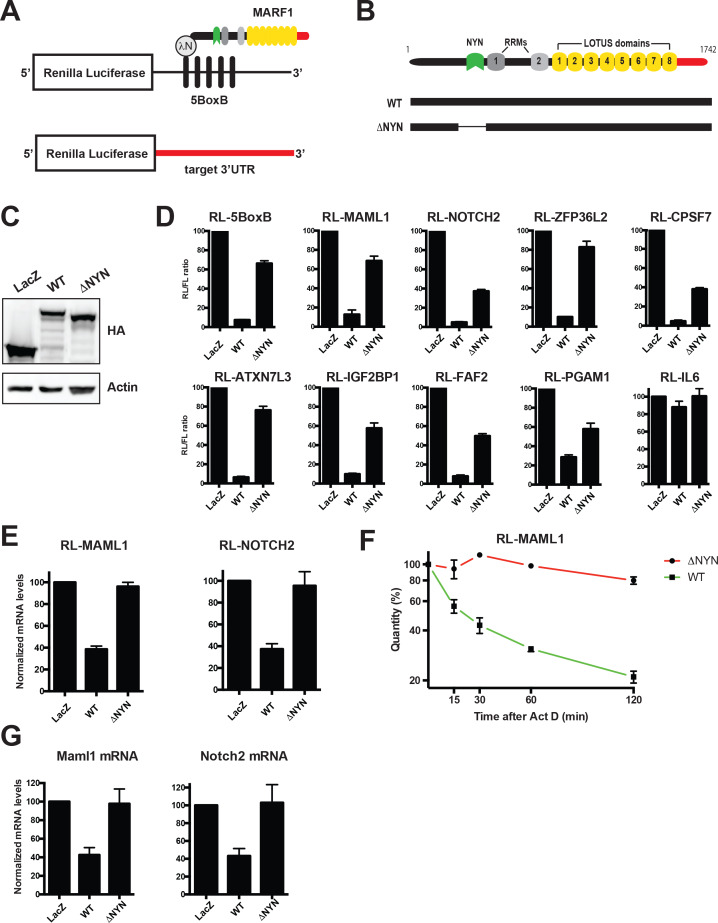
Figure 2. MARF1 represses target mRNAs via their 3’UTRs.
(A) Schematic diagram of the basic Renilla luciferase (RL)-encoding mRNA reporter, containing five 19-nt BoxB hairpins, interacting with λN-HA-MARF1, as well as a RL reporter with a 3’UTR from endogenous mRNAs. (B) Schematic diagram of full-length MARF1 and MARF1 fragments used in tethering assays. (C) Western blot analysis of HEK293 cells expressing indicated proteins. (D) RL activity detected in extracts from HEK293 cells expressing the indicated proteins. Cells were cotransfected with constructs expressing the RL-5BoxB reporter, FL, and indicated fusion proteins. Histograms represented normalized mean values of RL activity from a minimum of three experiments. RL activity values seen in the presence of λNHA-LacZ were set as 100. (E) RL-MAML1 (left panel) and RL-NOTCH2 (right panel) mRNA levels detected in extracts from HEK293 cells expressing the indicated proteins. Histograms represented mean values of RL-MAML1 or RL-NOTCH2 mRNAs normalized to FL mRNA from a minimum of three experiments. mRNA levels values seen in the presence of λNHA-LacZ were set as 100. (F) The stability of RL-MAML1 was assessed by using actinomycin D (5 μg/ml) for the indicated amount of time. Total RNA was isolated, reverse transcribed and RL-MAML1 RNA was quantified by qPCR. RL-MAML1 mRNA decay rates were normalized to FL mRNA levels with the zero time point set at 100. (G) Endogenous MAML1 and NOTCH2 mRNA levels detected in extracts from HEK293 cells expressing the indicated proteins. mRNA levels were normalized to GAPDH mRNA levels for a minimum of three experiments. mRNA levels in the presence of λNHA-LacZ were set as 100. Error bars represent the SEM of multiple independent experiments.

