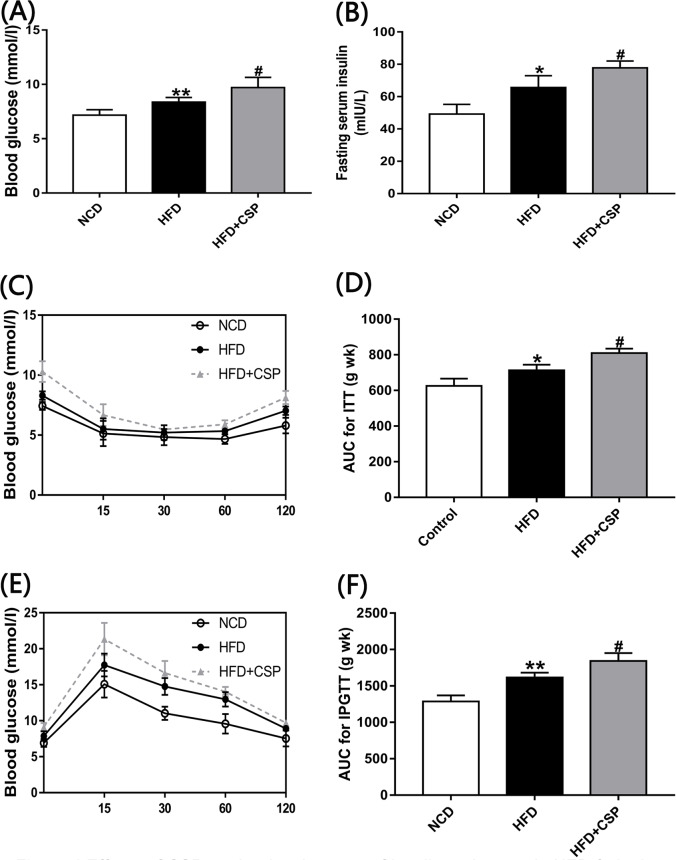
Fig 4.
Effects of CSP on the development of insulin resistance in HFD-fed mice A) Fasting blood glucose; B) Fasting blood insulin; C) Insulin tolerance test(ITT); D) Area under the curve(AUC) For ITT; E) Intraperitoneal glucose tolerance(IPGTT); F) AUC for IPGTT. Differences were assessed by ANOVA and denoted as follows: *P<0.05; **P<0.01 compared with NCD, #P<0.05 compared with HFD.

