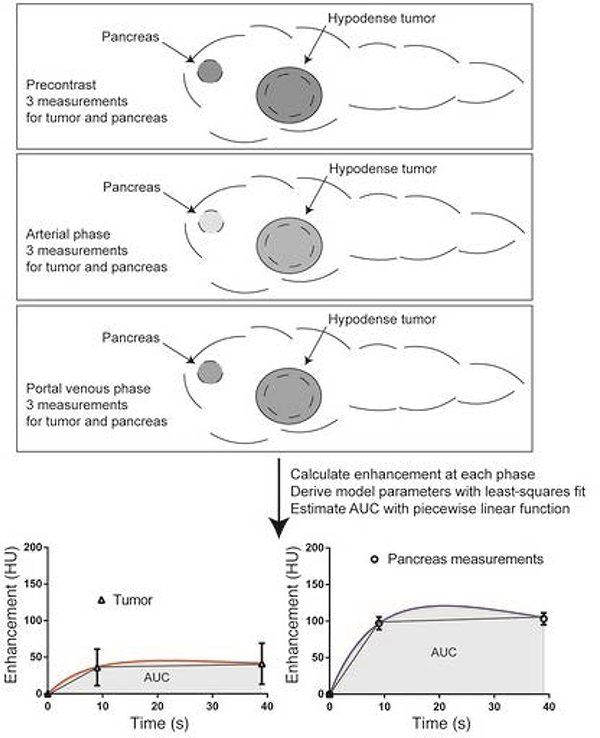
Figure 5.
A schematic showing the protocol for measurement of transport properties through CT imaging. Abdominal CT scans at the precontrast, arterial phase, and portal venous phase are obtained to acquire the contrast enhancement kinetics in the tumor and healthy pancreatic regions. The mathematical model is then fit to the imaging data to obtain an estimate for the area under the curve for both tumor and healthy regions. Reproduced with permission from Koay et al. [67].

