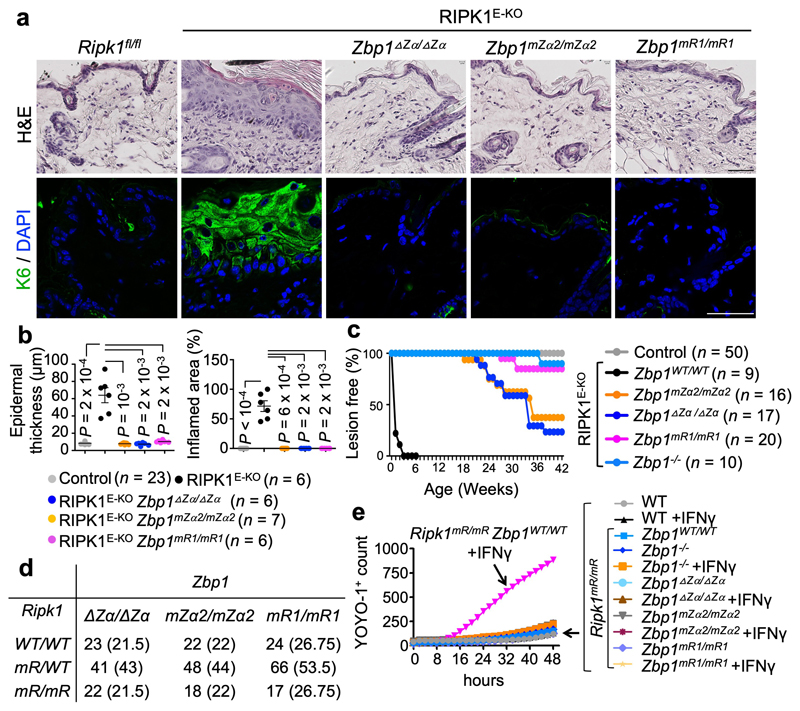
Figure 1. ZBP1 causes skin inflammation in RIPK1E-KO mice and perinatal lethality in Ripk1mR/mR mice by Zα-dependent and -independent mechanisms.
a, Representative images of skin sections from 6 - 7 week-old mice with the indicated genotypes stained with haematoxylin & eosin (H&E) or anti-keratin 6 (K6) antibodies and DAPI (DNA stain). RIPK1E-KO, n=6 for H&E and n≥5 for K6; RIPK1E-KO Zbp1mZα2/mZα2, n=9 for H&E and n≥3 for K6; RIPK1E-KO Zbp1∆Zα/∆Zα, n=15 for H&E and n≥3 for K6; RIPK1E-KO Zbp1mR1/mR1, n=10 for H&E and n≥3 for K6. Scale bars, 50 μm. b, Graphs depicting microscopic quantification of mean epidermal thickness (Epi. th.) and inflamed skin area in 6 - 7 week-old mice. Dots represent individual mice. Mean ± s.e.m are shown. P value by two-sided nonparametric Mann–Whitney test. c, Kaplan-Meier plot depicting lesion-free survival of mice with the indicated genotypes. Control mice include Ripk1FL/FL mice that do not express K14-Cre, or Ripk1FL/WT K14-Cre mice, with WT or mutated Zbp1 alleles. d, Table showing the numbers of weaned offspring from Ripk1mR/wt parents that were homozygous for the respective Zbp1 alleles. Expected numbers for mendelian inheritance are shown in brackets. e, Cell death measured by YOYO-1 uptake in MEFs with the indicated genotypes treated with IFNγ (1,000 u ml−1). Graph shows mean values from technical triplicates (n = 3) from one representative out of three independent experiments.

