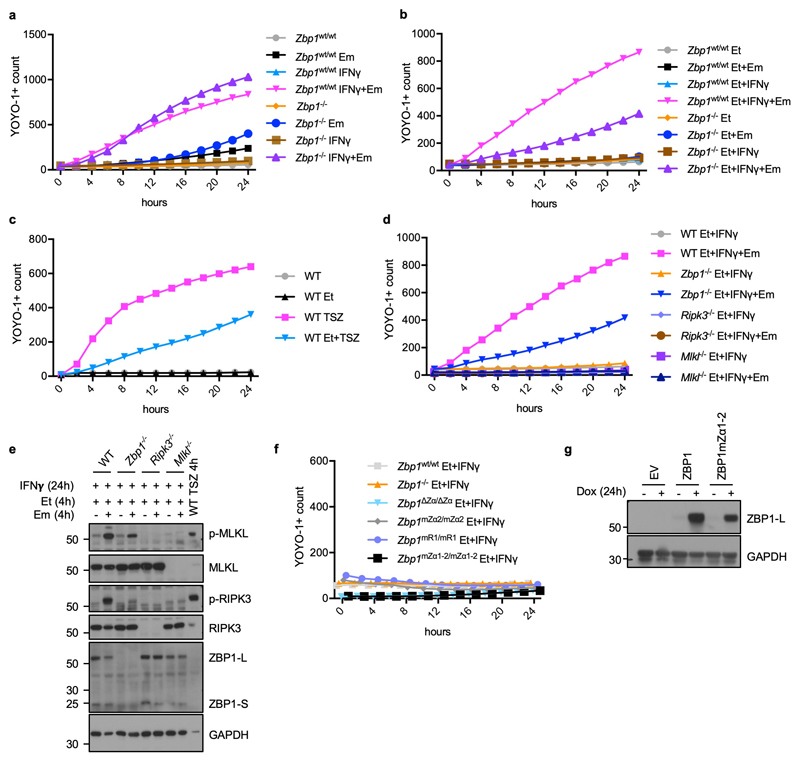
Extended Data Figure 6. IFNγ+emricasan in the presence of etanercept induces ZBP1 dependent cell death in MEFs.
a, b, Graphs depicting cell death assessment by YOYO-1 uptake in WT and ZBP1 KO MEFs treated with combinations of IFNγ (1,000 u ml−1, 24h pre-treatment), emricasan (em) (5 μM) and etanercept (et) (50 μg ml-1). c, Graph depicting cell death assessment by YOYO-1 uptake in WT MEFs treated with combinations of TNF (20 ng ml−1), birinapant (1 μM), Z-VAD-FMK (20 μM) and etanercept (50 μg ml-1). d, f, Graphs depicting cell death assessment by YOYO-1 uptake in MEFs (d) and LFs (f) with the indicated genotypes treated with combinations of IFNγ (1,000 u ml−1) (24 h pre-treatment), etanercept (50 μg ml−1) and emricasan (5 μM). e, Immunoblot analysis of total lysates from MEFs with the indicated genotypes stimulated with combinations of IFNγ (1,000 u ml−1) (24 h pre-treatment), etanercept (50 μg ml−1) and emricasan (5 μM). Total lysate from WT MEFs treated with TNF (20 ng ml−1)+birinapant (1 μM)+Z-VAD-FMK (20 μM) (TSZ) for 4h was used as positive control for p-MLKL and p-RIPK3 detection. g, Immunoblot analysis of total lysates from iMEFs transduced with lentiviruses expressing Flag (EV), Flag-tagged ZBP1 or Flag-tagged ZBP1mZα1-2 stimulated with doxycycline (1 μg ml−1) for 24 h. Representative data in panel a (n = 6), b (n = 9), c (n = 3), d (n = 6), e (n = 3), f (n = 4) and g (n = 2). Panels (a, b, c, d, f) show mean values from technical triplicates (n = 3). Data shown in panel f serve as control for the data shown in Fig. 2d and come from the same experiment. GAPDH was used as a loading control for immunoblot analysis. For gel source data, see Supplementary Fig. 1.

