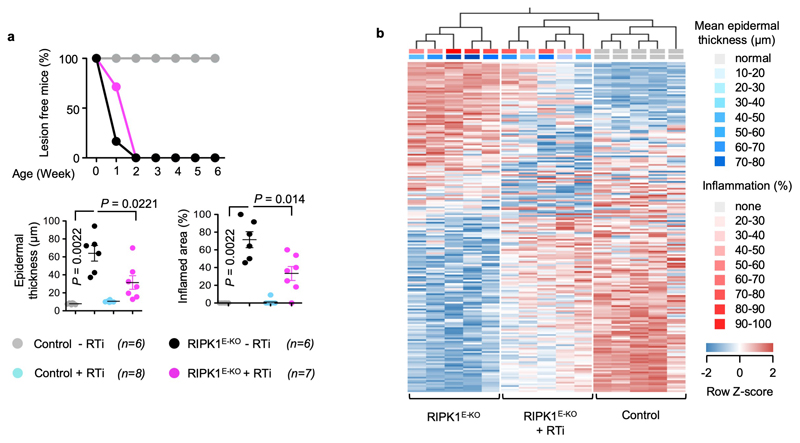
Extended Data Figure 8. Treatment with reverse transcriptase inhibitors ameliorates skin inflammation in RIPK1E-KO mice.
a, Kaplan-Meier plot depicting lesion-free survival (top panel) and microscopic quantification of mean epidermal thickness and inflamed skin area (bottom panels) of mice with the indicated genotypes that were treated or not with reverse transcriptase inhibitors (RTi) from birth till the age of 6 weeks. Each dot represents an individual mouse. Data show mean ± s.e.m. P value by two-sided nonparametric Mann–Whitney test. The data from untreated control and RIPK1E-KO mice are included also in Figure 1b, c. b, Hierarchical clustering of samples from control (n = 5) and RIPK1E-KO mice (n = 10) according to the expression of genes that are differentially expressed (≥ 1.75-fold, p ≤0.05, two-sided t-test, performed in Qlucore Omics Explorer 3.3) between untreated (n = 5) and RTi-treated RIPK1E-KO mice (n = 5). Each column corresponds to one mouse. The mean epidermal thickness and inflammation score for each mouse are indicated. Control mice include Ripk1FL/FL mice that do not express K14-Cre, or Ripk1FL/WT K14-Cre mice.

