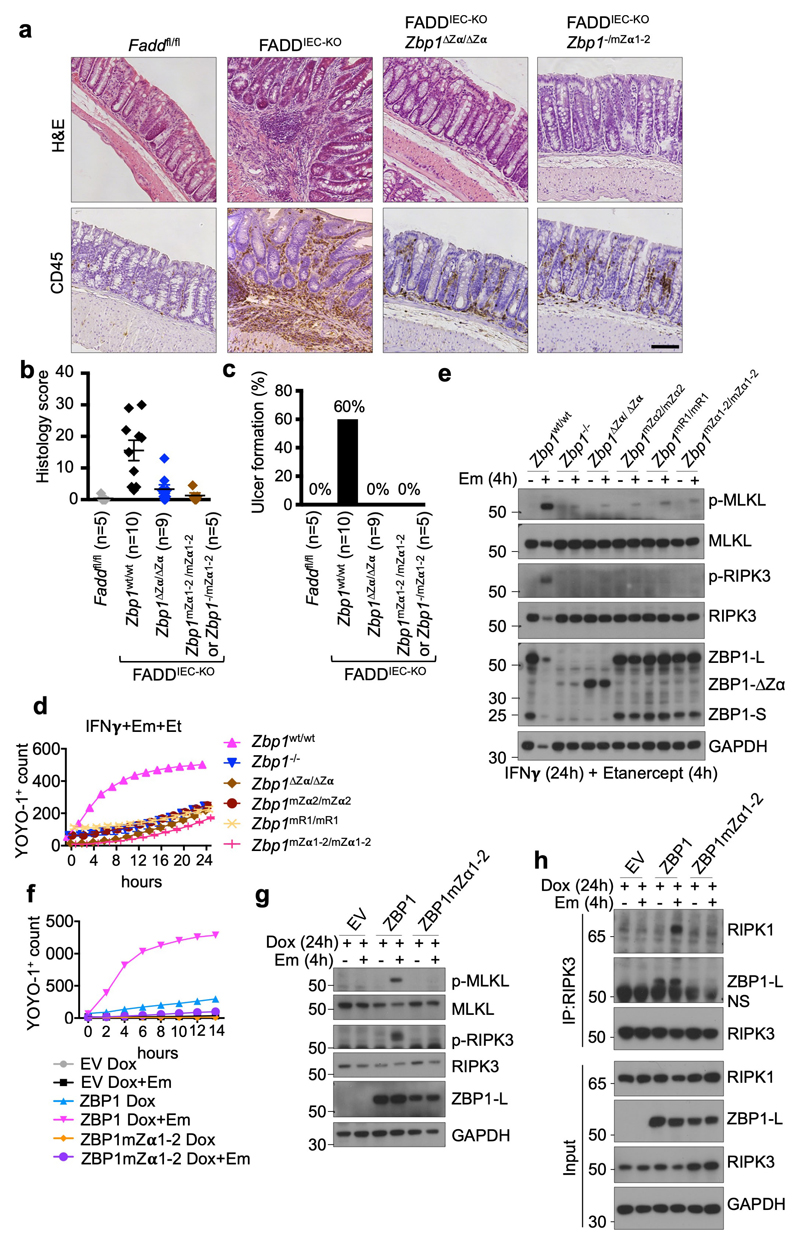
Figure 2. Zα-dependent Z-NA sensing induces ZBP1-mediated necroptosis and colitis when FADD-caspase-8 function is inhibited.
a-c, Representative images of colon sections stained with H&E or immunostained for CD45 (a), and graphs depicting histological colitis score (b) and incidence of ulcer formation (c) from 10 week-old mice with the indicated genotypes. Scale bar = 100μm. Dots represent individual mice. Mean ± s.e.m are shown. P value by two-sided nonparametric Mann–Whitney test. d, e, Cell death measured by YOYO-1 uptake (d) and immunoblot analysis of total lysates (e) in LFs with the indicated genotypes treated with combinations of IFNγ (1,000 u ml−1) (24 h pre-treatment), etanercept (50 μg ml−1) and emricasan (5 μM). f-h, Cell death measured by YOYO-1 uptake (f), and immunoblot analysis of total lysates (g) and anti-RIPK3 immunoprecipitates (f) in iMEFs expressing doxycycline (Dox)-induced Flag (EV), Flag-tagged ZBP1 or Flag-tagged ZBP1mZα1-2 stimulated with combinations of Dox (1 μg ml−1) (24 h pre-treatment) and emricasan (5 μM). Data are representative of two (e, g, h), four (d) and three (f) independent experiments. Graphs in d and f show mean from technical triplicates (n = 3). GAPDH was used as a loading control for immunoblot analysis. For gel source data, see Supplementary Fig. 1.

