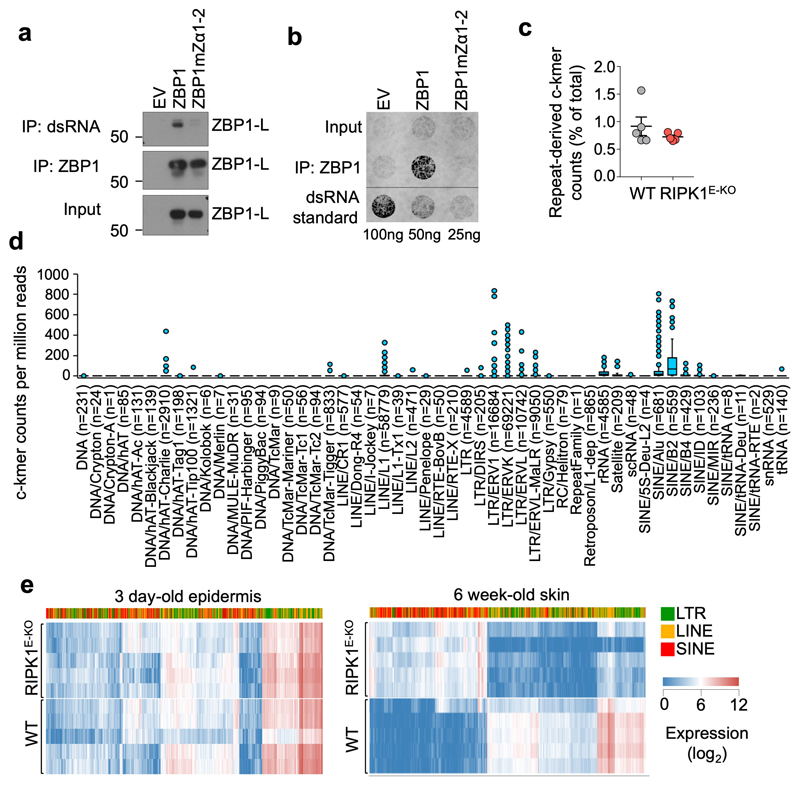
Figure 3. The ZBP1 Zα domains bind cellular dsRNA likely derived from endogenous retroelements.
a, b, Immunoblot analysis of J2 anti-dsRNA mAb immunoprecipitates, anti-ZBP1 immunoprecipitates and total lysates (input) (a) and dot blot analysis performed with J2 anti-dsRNA mAb on RNA isolated from anti-ZBP1 immunoprecipitates or total cell lysates (input) (b) from iMEFs expressing doxycycline-inducible Flag (EV), Flag-tagged ZBP1 or Flag-tagged ZBP1mutZα1-2 stimulated with Dox (1 μg ml−1) for 24 h. c, Proportion of repeat-derived complementary kmer (c-kmer) counts in total kmer counts in stranded RNA-seq data from the epidermis of 3 day-old WT (n=5) and RIPK1E-KO mice (n=5). Dots represent individual mice. Mean ± s.e.m are shown. d, Box plots of repeat-derived c-kmer counts, normalised by sequencing depth, according to the repeat class they associate with. Counts represent the mean value of all WT (n=5) and RIPK1E-KO mice (n=5) from c. Counts of the least abundant c-kmer of each complementary pair are shown. Numbers in brackets denote the total number of unique c-kmers identified for each repeat class. Box plots show the upper and lower quartiles, centre lines show the median, whiskers represent the 1.5x interquartile range and individual points represent outliers. e, Heatmap showing expression of EREs in the epidermis of 3 day-old or skin of 6 week-old WT and RIPK1E-KO mice. Only EREs that were differentially expressed by ≥10-fold (q≤0.01) between 6 week-old WT and RIPK1E-KO mice are shown. Each row represents an individual mouse. Data are representative of four (a) and two (b) independent experiments. For gel source data, see Supplementary Fig. 1.

