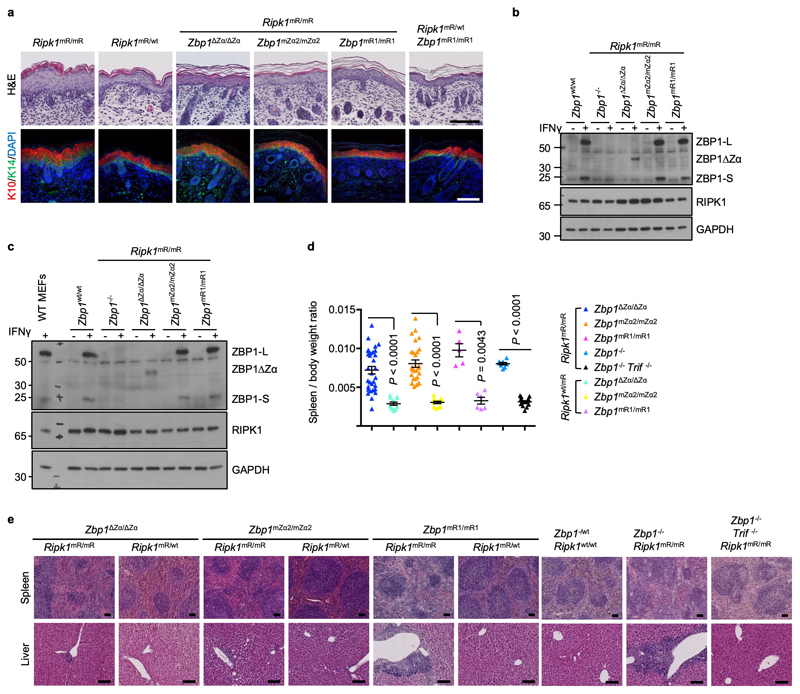
Extended Data Figure 4. ZBP1-mediated perinatal lethality in Ripk1mR/mR mice depends on Zα-dependent sensing of Z-NA and RHIM1-mediated signalling.
a, Representative pictures of skin sections from mice with the indicated genotypes stained with H&E or immunostained with antibodies against K10 and K14 and counterstained with DAPI visualising nuclear DNA. Skin sections from Ripk1mR/mR or Ripk1mR/wt E18.5 embryos are compared with skin from newborn (P1 to P3) double mutant mice. Scale bars = 100 μm. Ripk1mR/mR (n = 3), Ripk1mR/wt (n = 3), Ripk1mR/mR Zbp1∆Zα/∆Zα (n = 3), Ripk1mR/mR Zbp1mZα2/mZα2 (n = 3), Ripk1mR/mR Zbp1mR1/mR1 (n = 6), Ripk1mR/wt Zbp1mR1/mR1 (n = 3). b, c Immunoblot analysis of total lysates from primary LFs (b) and keratinocytes (c) with the indicated genotypes stimulated with IFNγ (1,000 u ml−1) for 24 h. d, Spleen to bodyweight ratio of mice with the indicated genotypes. Each dot represents an individual mouse. Data show mean ± s.e.m. P value by two-sided unpaired t-test or nonparametric Mann–Whitney test. e, Representative H&E stained sections from spleen and liver of mice with the indicated genotypes. Ripk1wt/wt Zbp1-/wt (n = 5), Ripk1mR/mR Zbp1-/- (n = 6), Ripk1mR/mR Zbp1-/- Trif-/- (n = 6), Ripk1mR/mR Zbp1∆Zα/∆Zα (n = 13), Ripk1mR/wt Zbp1∆Zα/∆Zα (n = 10), Ripk1mR/mR Zbp1mZα2/mZα2 (n = 21), Ripk1mR/wt Zbp1mZα2/mZα2 (n = 3), Ripk1mR/mR Zbp1mR1/mR1 (n = 4), Ripk1mR/wt Zbp1mR1/mR1 (n = 6). Representative data shown in panels b (n = 2) and c (n = 2). GAPDH was used as a loading control for immunoblot analysis. For gel source data, see Supplementary Fig. 1.

