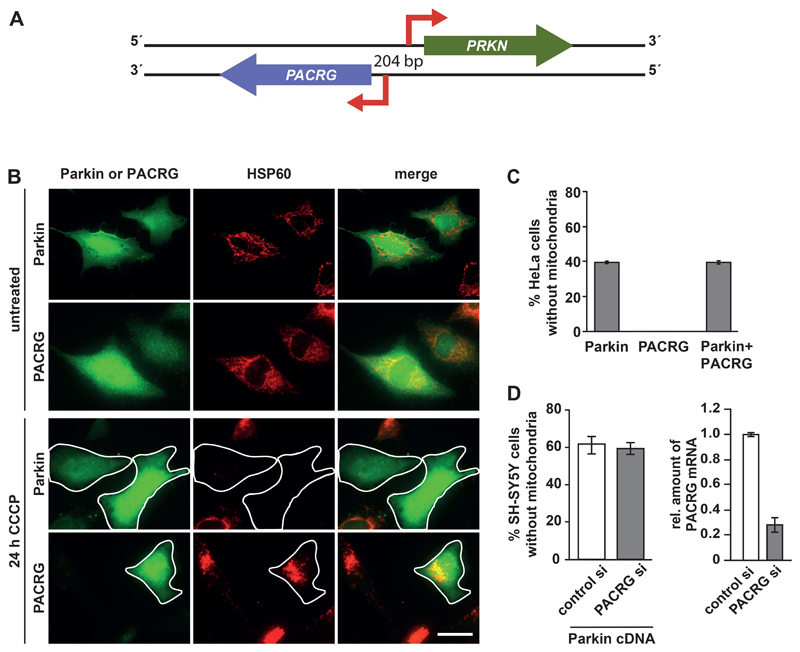
Fig. 1. PACRG does not influence mitophagy.
(A) Schematic representation of the PRKN and PACRG locus. The genes encoding Parkin and PACRG are linked in a head-to-head arrangement on opposite DNA strands and share a 5' core bi-directional promoter of 204 base pairs. (B) Representative immunofluorescence images of HeLa cells transiently expressing HA-tagged PACRG or Parkin and treated with CCCP to induce mitochondrial depolarization and subsequent degradation. Fixed cells were analyzed by indirect immunofluorescence using either the Parkin-specific antibody PRK8 or an HA antibody to detect PACRG and an Hsp60-specific antibody to visualize mitochondria. Scale bar, 100 µm. (C) Quantification of CCCP-induced mitochondrial clearance in HeLa cells expressing Parkin, PACRG, or both Parkin and PACRG. (D) Quantification of CCCP-induced mitochondrial clearance in SH-SY5Y cells transfected with control or PACRG siRNAs together with Parkin cDNA. PACRG knockdown efficiency was determined by real-time RT-PCR using exon-flanking PACRG-specific primers. Data represent the mean ± SEM of at least 3 independent experiments each performed in triplicate. At least 300 transfected cells were counted per condition. For statistical analysis Mann-Whitney U-test was performed. *p ≤ 0.05; **p ≤ 0.01; ***p ≤ 0.001.

