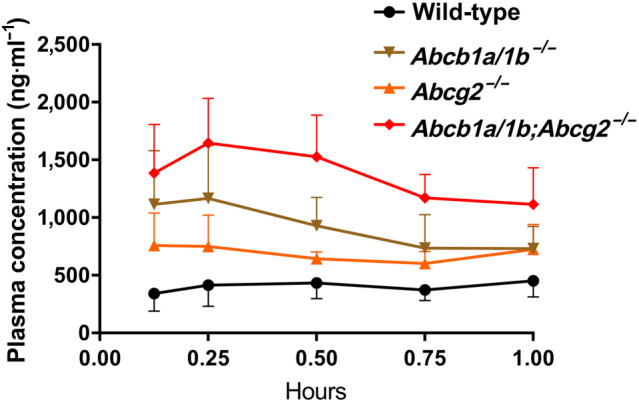
FIGURE 2.

Plasma concentration–time curves of larotrectinib in male wild‐type, Abcb1a/1b −/−, Abcg2 −/−, and Abcb1a/1b;Abcg2 −/− mice over 1 hr after oral administration of 10 mg·kg−1 of larotrectinib. Data are given as mean ± SD (wild‐type and Abcb1a/1b −/−, n = 7; Abcg2 −/− and Abcb1a/1b;Abcg2 −/−, n = 6)
