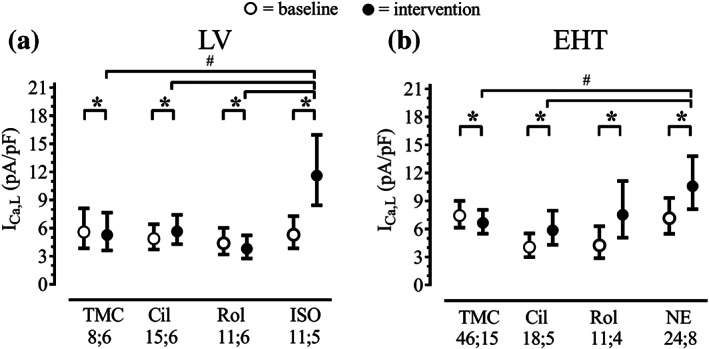
FIGURE 2.

Effect of PDE‐inhibitors and β‐adrenoceptor agonists on calcium current in myocytes from human LV (a) and hiPSC‐EHTs (b). Baseline and intervention, model‐estimated marginal means with 95% confidence intervals after back‐transformation (exponentiation), P < .05, significantly different as indicated, baseline versus respective intervention, # P < .05, significantly different as indicated between interventions; pairwise comparisons sequentially step‐down rejective Bonferroni‐adjusted; n; n = number of cells; number of patients, or number of EHTs; number of differentiation batches. TMC: time control; Cil: cilostamide (0.3 μM); Rol: rolipram (10 μM); ISO: isoprenaline (10 μM), NE: noradrenaline (100 μM). Results of F tests for LV (F values with dfmean;dferror in brackets) with P values of effects: P condition (TMC, Cil, Rol, ISO) = .039 (F[3;41] = 3.045), P time point (baseline, intervention) < .001 (F[1;41] = 27.41), P Condition × Time point < .001 (F[3;41] = 36.50). Results of F tests for EHT (F values with dfmean;dferror in brackets) with P values of effects: P condition (TMC, Cil, Rol, NE) = .029 (F[3;95] = 3.137), P time point (baseline, intervention) < .001 (F[1;95] = 90.81), P Condition × Time point < .001 (F[3;95] = 31.24). See Section 2 for further information on data analytical procedures. This figure is related to Figure S3
