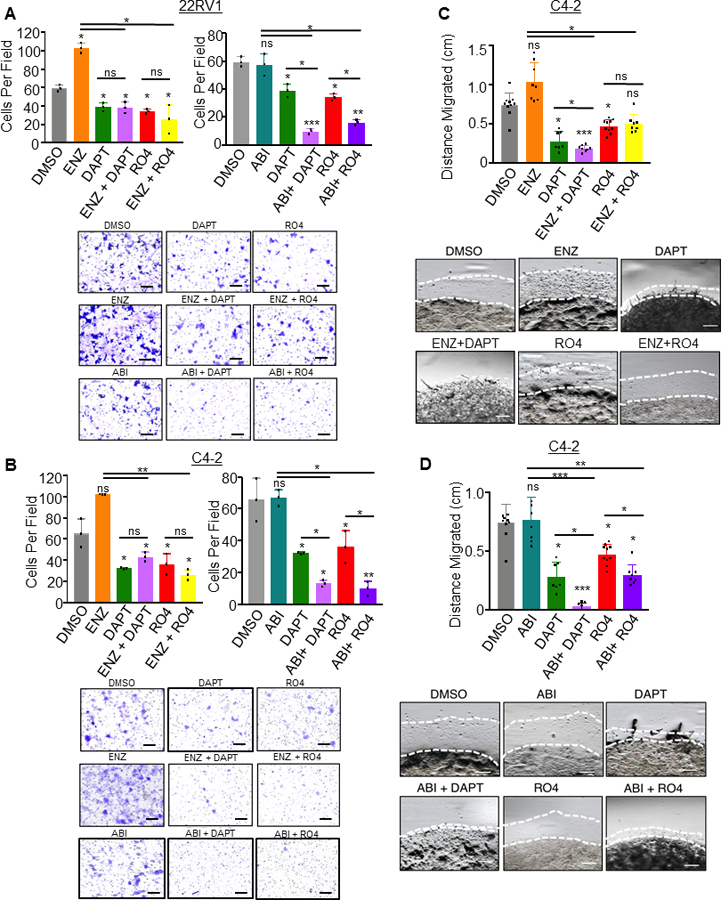
Figure 6. Notch1 inhibition synergizes with anti-androgens Enzalutamide and Abiraterone to inhibit prostate cancer cell invasion and migration in vitro.

For invasion assays, 5×10⁴ cells were plated in Matrigel coated transwell invasion chambers. Cells were drug treated 72 hours prior to serum starving overnight, and plating in chambers. A. 22RV1 cells were treated with DAPT (50 μM), ENZ (5 μM), ABI (5 μM), RO4929097 (RO4) (20 μM), or combination of ENZ with DAPT or RO4 and ABI with DAPT or RO4. B. C4–2 cells were treated with DAPT (50 μM), ENZ (5 μM), ABI (5 μM), RO4929097 (RO4) (20 μM), or combination of ENZ with DAPT or RO4 and ABI with DAPT or RO4. Chambers were incubated 36 hours for 22RV1 and 24 hours for C4–2 cells, then fixed in methanol and stained in 0.1% crystal violet. Five images were captured per chamber at 161X, performed in triplicate chambers and averaged. Experiments were performed concurrently and graphed separately for each cell line for ease of visualization, thus DMSO, DAPT and RO4 conditions are based on the same samples in these graphs. C,D. 2×10⁵ C4–2 cells were resuspended in 20 μl Matrigel and plated as a 3D dot on a 12 well plate. After Matrigel solidified, media was added and wells were treated with ENZ, DAPT, RO4, combined ENZ with DAPT or RO4 (C) or ABI, DAPT, RO4 or combined ABI with DAPT or RO4. Media was changed every 48 hours. Dots were imaged at four leading edges at Day 0 and Day 5 and distance migrated (millimeters mm) was calculated. ENZ and ABI experiments were performed concurrently, then graphed separately for ease of visualization, thus in (C) and (D), DMSO, DAPT and RO4 conditions are based on the same samples. Scale bars = 250μm. All experiments performed in triplicate with representative images shown. *=P<0.05; **=P<0.01; ***=P<0.005; ns= no significance. Error bars +/− SD.
