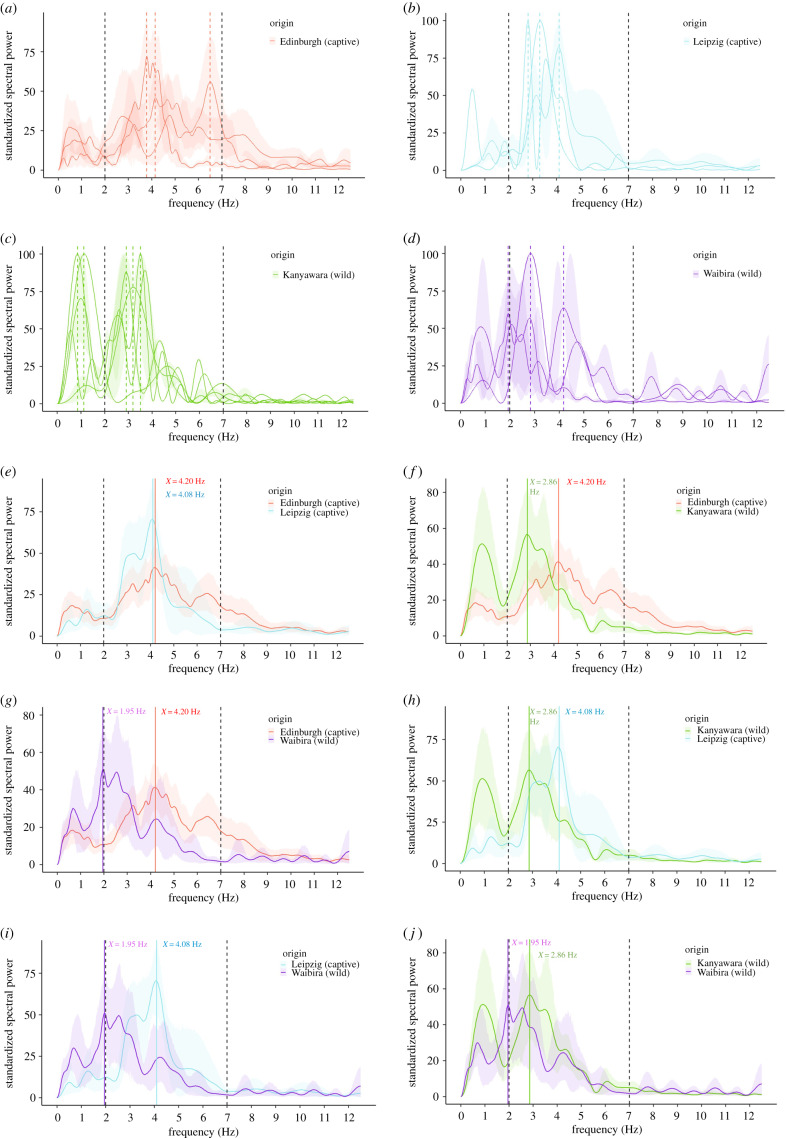
Figure 2.
Mean standardized power spectral density plot of each individual's lip-smack production rate in each population (a–d) and mean standardized power spectral density plot of each pair of populations (e–j). Shaded areas represent the mean ±95% confidence interval standardized power spectral density plot per individual (a–d) and per population (e–j). Coloured dashed vertical lines indicate maximum frequency peak per individual (a–d) and per population (e–j). Black dashed vertical lines indicate limits of speech-like rhythm frequencies.

