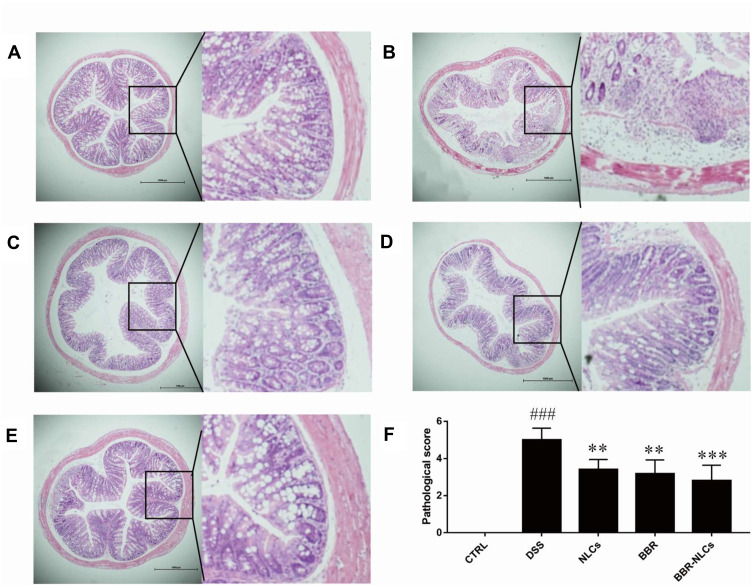
Figure 7.
Representative colon tissue sections stained with hematoxylin and eosin visualized using a microscope.
Notes: (A) control; (B) DSS; (C) NLCs; (D) BBR; (E) BBR-NLCs. (F) Colitis histological score for each group. The scale bar = 1000 µm. Data are expressed as mean ± SD (n = 6). ###P < 0.001 compared with the control group; **p < 0.01, ***p < 0.001 compared with the DSS group.

