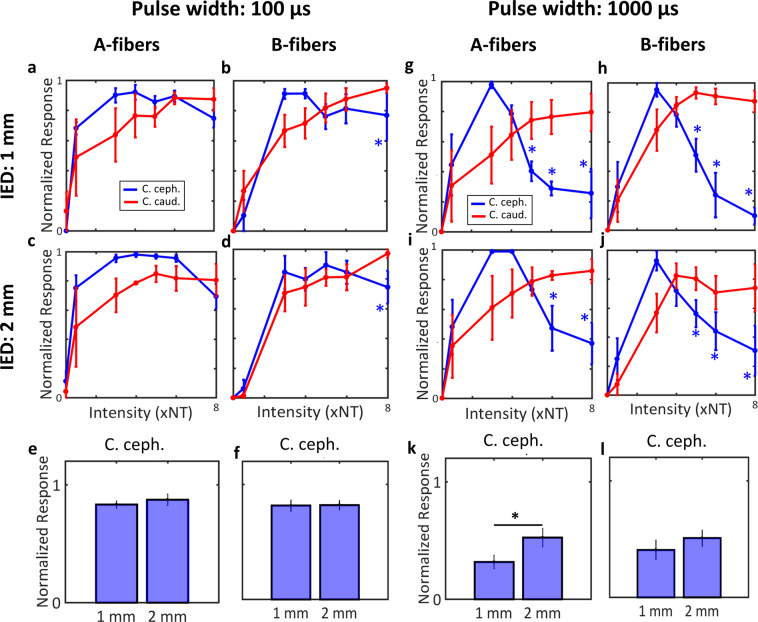
Figure 5.
Stimulus polarity and average A- and B-fiber response magnitudes, for different pulse widths and inter-electrode distances. (a,b) Average (mean ±SEM, 4 animals) response magnitudes of A- and B-fibers, respectively, to stimuli with short pulse width (100 μs), delivered through a bipolar electrode with 1 mm-inter-electrode distance (IED). Shown are the responses to both polarities, as a function of stimulus intensity. Blue asterisks denote statistically significant intensity levels at which anodal block of the corresponding fibers occurred (i.e. the response to cathode cephalad polarity became smaller that of the cathode caudad; paired t-test, p < 0.05). (c,d) Same as before (panels a,b), with an IED of 2 mm. (e,f) Comparison of average response magnitudes of A- and B-fibers, respectively, for cathode cephalad polarity, between 1 mm- and 2 mm-IED, for short pulse widht: 100 μs (paired t-test, p NS). (g,h) Average response magnitudes of A- and B-fibers, respectively, to stimuli with long pulse width (1000 μs), delivered with an IED of 1 mm (paired t-test; blue asterisks denote p < 0.05). (i,j) Same as before (panels g,h), but with an IED of 2 mm (paired t-test; blue asterisks denote p < 0.05). (k,l) Comparison between 1 mm- and 2 mm-IED similarly to panels e and f, but for long pulse width: 1000 μs (paired t-test, fig. k p = 0.05; fig. l p NS).

