Figure 6.
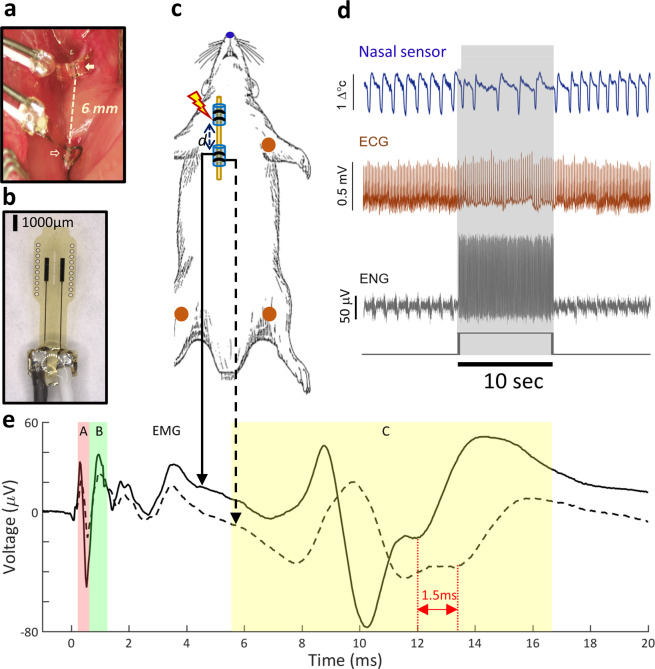
Experimental setup, electrodes, physiological sensors and signals. (a) Two bipolar cuff electrodes shown placed below corresponding exposed parts of the cervical vagus nerve in a rat, at a distance of 6 mm from each other. The rostral electrode (filled arrow) is used for stimulation, the caudal (open arrow) for recording. (b) Close-up image of a bipolar, Flex electrode. (c) Schematic of the animal with the 2 vagus nerve electrodes and the sensors for physiological measurements: nasal temperature sensor for resolving air flow (blue), electrocardiogram (ECG) sensors (2 differentials and 1 ground) for registering ECG (red). (d) Snippet of signals acquired during delivery of a 10 s-long (300 pulse count) VNS train (rectangular black trace at bottom panel): temperature signal from nasal sensor (top panel, blue trace), voltage signal from ECG sensor (second panel, red trace), electroneurogram (ENG) signal from recording nerve electrode (third panel, grey trace). In the raw ENG signal, periodic modulations associated with breathing and stimulation artifacts associated with VNS were also observed. (e) Stimulus-evoked compound nerve action potential (sCNAP) compiled by averaging single ENG sweeps around the onset of each of the 300 stimuli in the VNS train. The solid and the dotted trace represent the 2 sCNAPs recorded on the 2 contacts of a bipolar recording cuff; notice the time-shift in the 2 traces for slow-conducting C-fibers, corresponding to different arrival times of CNAPs at the 2 recording contacts, and the lack of time-shift for extra-neural EMG, which is recorded simultaneously on both contacts. The colored shaded areas represent the windows of latencies (minimum and maximum latency) for each of the 3 fiber type and EMG activity: red for A fibers (0.3–0.95 ms), green for B fibers (0.7–1.2 ms), yellow for C fibers (5.5–16.6 ms) and white for EMG (2–10 ms). The latency windows were calculated based on the known conduction velocities of fibers types and distance between stimulating and recording electrodes. The magnitude of activation for each fiber type was calculated as the amplitude of the CNAP component within each of the 4 latency windows.

