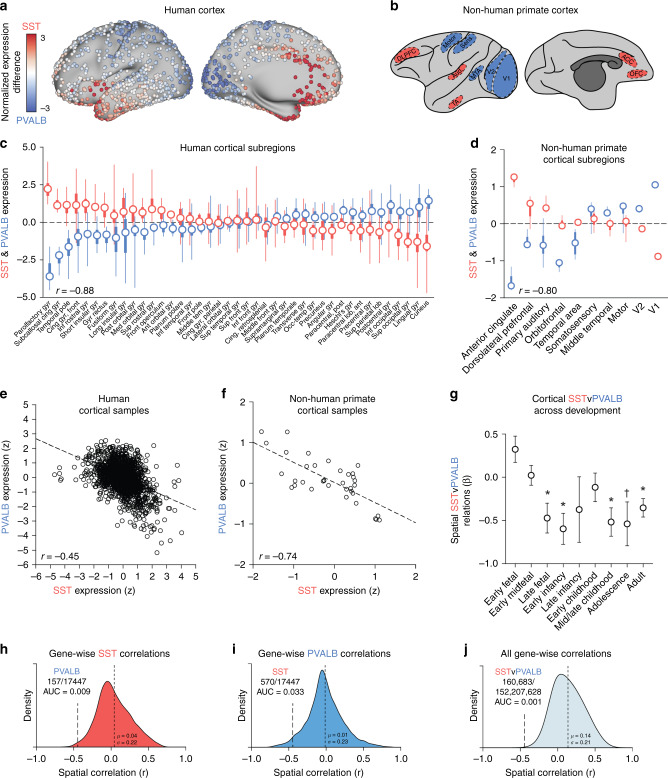
Fig. 1. Cortical expression of SST and PVALB are negatively correlated across species and developmental stages.
a AHBA tissue samples mapped to the human cortical surface, and b an illustration of non-human primate tissue sample locations, colored by relative expression of SST (red) and PVALB (blue). Normalized expression difference reflects the sample-wise subtraction of z-transformed PVALB from SST. Relative SST–PVALB expression among anatomically defined groups from the c AHBA (n = 6 donors; n = 1683 samples; n = 41 regions) and d NIH Blueprint Non-Human Primate Atlas (n = 4 donors; n = 182 samples; n = 10 regions); circles = median, thick lines = interquartile range, thin lines = min and max values. e Sample-wise negative correlation of SST and PVALB in human cortex (r = −0.45, p < 2.2e−16; rs = −0.40, p < 2.2e−16) and f non-human primates (r(34) = −0.74, p = 2.2e−7; rs = −0.60, p = 0.0001). g Correlation of cortical SST and PVALB across nine developmental stages using data from the Brainspan Atlas of the Developing Human Brain (n = 42 donors; n = 362 samples; n = 9 developmental stages). h–j The SST to PVALB correlation is at the left tail of the distribution of all gene-wise correlations to SST (AUC = 0.009) and to PVALB (AUC = 0.033), as well as all possible two-gene spatial correlations (AUC = 0.001). *p ≤ 0.05, uncorrected; †p ≤ 0.10; error bars = standard error.

