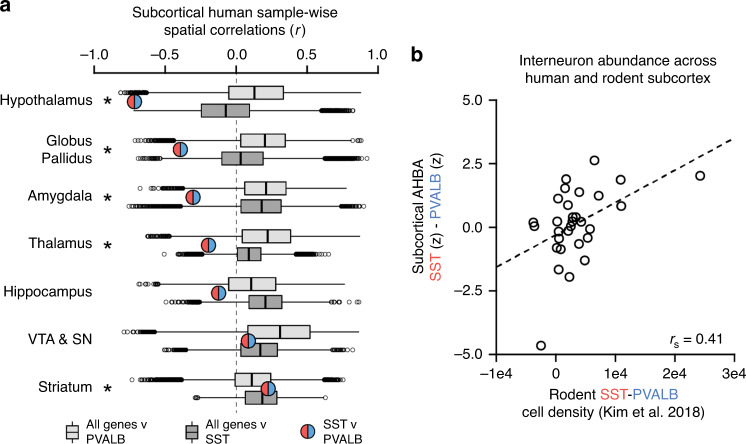
Fig. 3. Subcortical SST and PVALB correlation and consistency in rodents.
a The correlation between SST and PVALB was estimated using AHBA data for each of seven subcortical territories. Red/blue circles denote Pearson correlations between SST and PVALB. Light and dark gray boxplots show the distribution of spatial correlations of all other genes (n = 17,447) to PVALB and SST, respectively (center = median, box = Q1–Q3, whiskers = 1.5*IQR, circles = outliers). The strength of the SST to PVALB relationship is quantified relative to gene-wide reference distributions. SST was more negatively correlated to PVALB than what is expected by chance in the hypothalamus (r(100) = −0.72, q = 1.9e−16, AUCsst = 0.002, AUCpvalb = 0.01), globus pallidus (r(37) = −0.39, q = 0.011), amygdala (r(65) = −0.30, q = 0.019), and thalamus (r(173) = −0.19, q = 0.019), but not the hippocampus (r(156) = −0.12, q = 0.14), ventral tegmentum/substantia nigra (r(63) = 0.09, q = 0.50), and striatum (r(168) = 0.23, q = 0.011). b Relative expression of SST and PVALB in human subcortical areas when compared to ground truth cell densities in rodent homologs from Kim et al.11 (Spearman’s rs = 0.41, p = 0.025).

