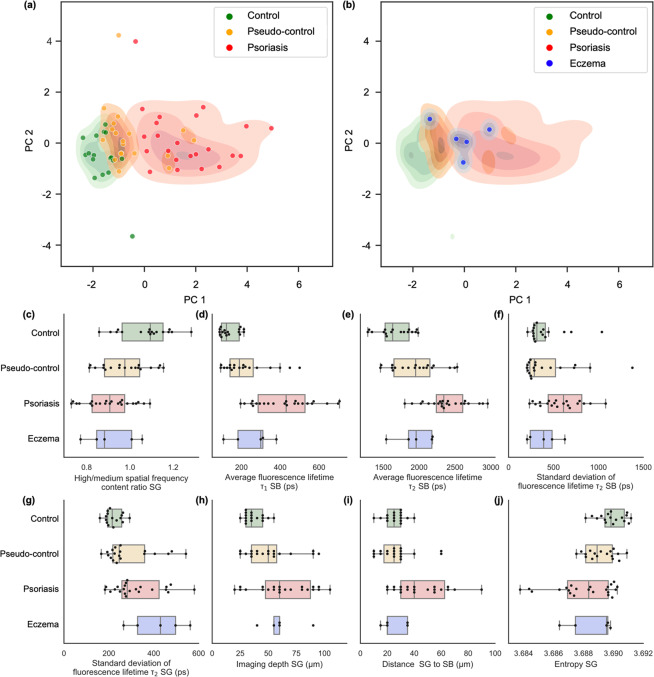
Figure 2.
Principal component analysis with kernel density estimates reveals distinct clusters of different skin conditions separated mostly along PC1. (a) Low values of PC1 correspond to healthy skin in the control group. Increasingly higher values of PC1 indicate the spectrum of skin conditions transitioning from healthy to pseudo-control to psoriasis. (b) Eczema patients form a cluster at the interface between pseudo-control and psoriasis clusters. Outliers can be explained by errors induced by severe artifacts caused by subject movements during image acquisition. Shaded areas show estimated kernel density map for the corresponding groups. (c–j) Box plots, summarizing the extracted features used for principal component analysis.

