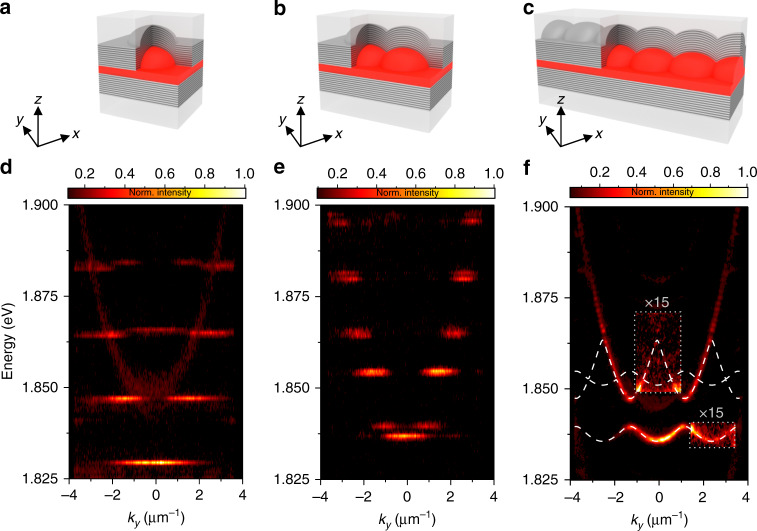
Fig. 1. Schematic images and angle-resolved measurements of our device.
a–c Artistic illustration of single trap (a), molecular configuration (b), and one-dimensional lattice (c). The hemispheric indentations are filled with the “mCherry” proteins (red). d–f Angle-resolved photoluminescence spectrum of a single trapping site (d), as well as a molecular configuration (e) and the one-dimensional lattice (f), proving the formation of a bandgap polariton spectrum resulting from evanescent coupling between the sites. White lines show calculated single-particle energy bands in the effective periodic potential of the depth −270 meV and in the gray lined area the intensity is enhanced 15-fold. The measurements are recorded at a detuning between the cavity photon and exciton energy of Δ = EC − EX = −100 meV (at k = 0 of the ground Bloch band). Note that slight variations in the energies of the emission spectra in d–f arise from a modest variation in the detuning between the structures.

