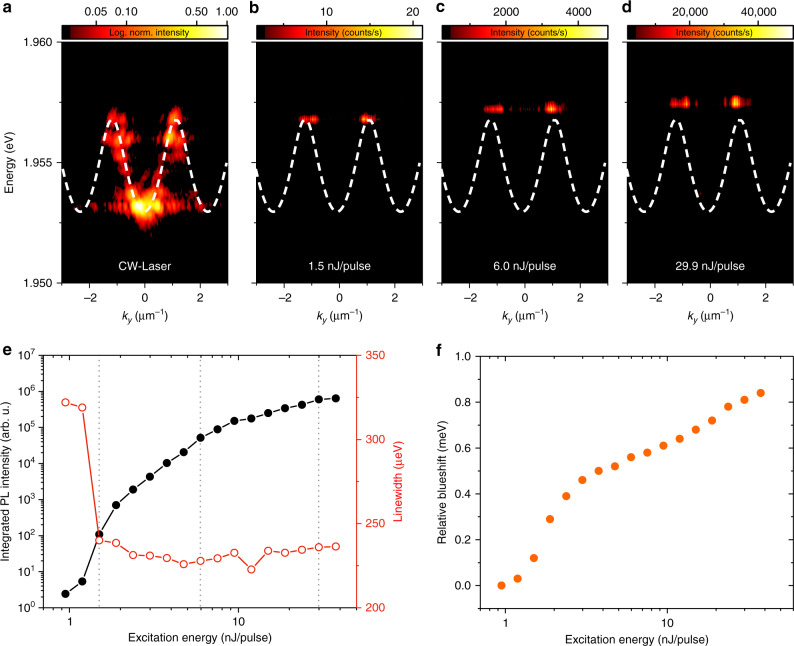
Fig. 2. Excitation power-dependent analysis of an one-dimensional lattice.
a–d Far-field photoluminescence spectra recorded at various pump powers. Excitation with a continuous-wave laser (a), the white line shows calculated single-particle energy s-band in the effective periodic potential. Angled-resolved spectra for pump powers at the condensation threshold (b P = 1.5 nJ/pulse), above the threshold (c P = 6.0 nJ/pulse), and far above the threshold (d P = 29.9 nJ/pulse). The condensed mode moves into the gap. e Integrated emission intensity (black) and linewidth (red) versus excitation energy. At P = 1.5 nJ/pulse, the linewidth drops to the resolution limit of the spectrometer, whereas the intensity clearly features a superlinear increase. f Excitation power-dependent blueshift of the mode.

